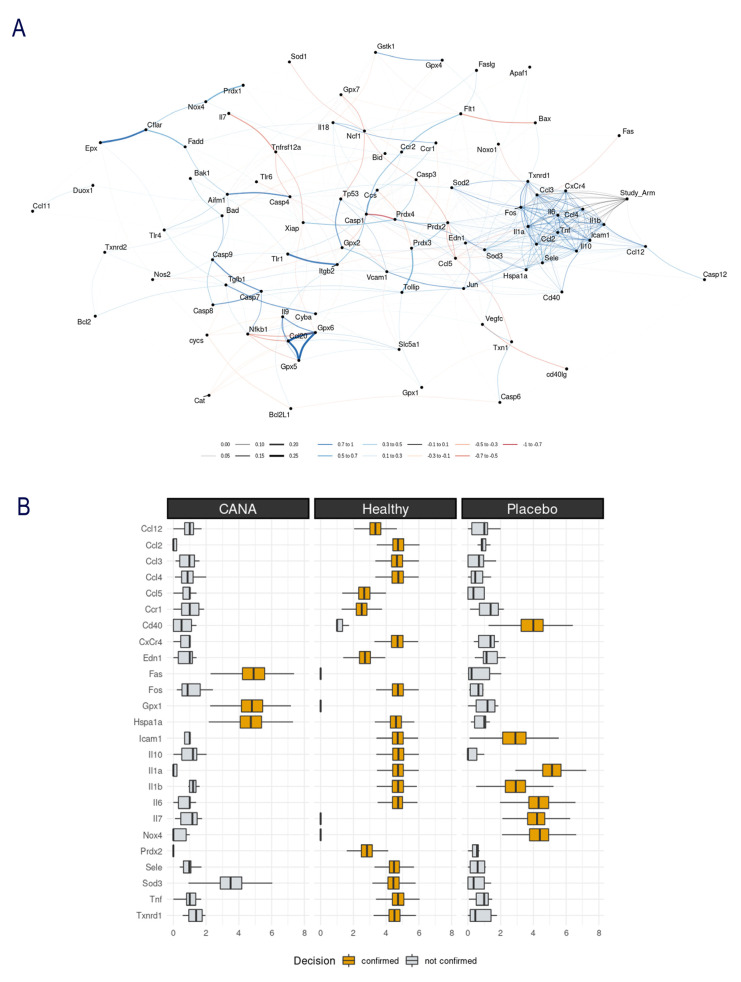
Figure 3.
Machine-learning analysis: (A) Gene correlation network: a node represents each investigated gene. The closeness between nodes and the connection width are proportional to the random-forest variable importance. The colors indicate the Spearman’s coefficients: blue or red lines are associated with a positive or negative correlation, respectively. The grey connections are random-forest patterns without a significant Spearman coefficient. “Study arm” is the group variable: Control/IR/IR + CANA. This node is connected (right side of the network), with a cluster of genes, including Txnrd1, Ccl3, CxCr4, Il6, Ccl4, Il1b, Tnf, Ccl2, Il10, IL1a, Fos, Sod3, Hspa1a, Cd40, Ccl12 and Icam1. These genes are in a significant positive Spearman correlation with each other. In contrast, the other tested genes do not show a cluster pattern. (B) Genes predicting the experimental group (Control, IR, or IR + CANA). The genes identified with the yellow horizontal box plots respond to the question: “is this IR + CANA or not?”, “is this Control or not?”, “is this IR or not?”. The Y-axis depicts genes (abbreviations are defined in Table 1) and the horizontal axis indicates the predictive power of a gene for the group identification, as calculated by the random forest model. IR indicates ischemia/reperfusion, CANA canagliflozin.

