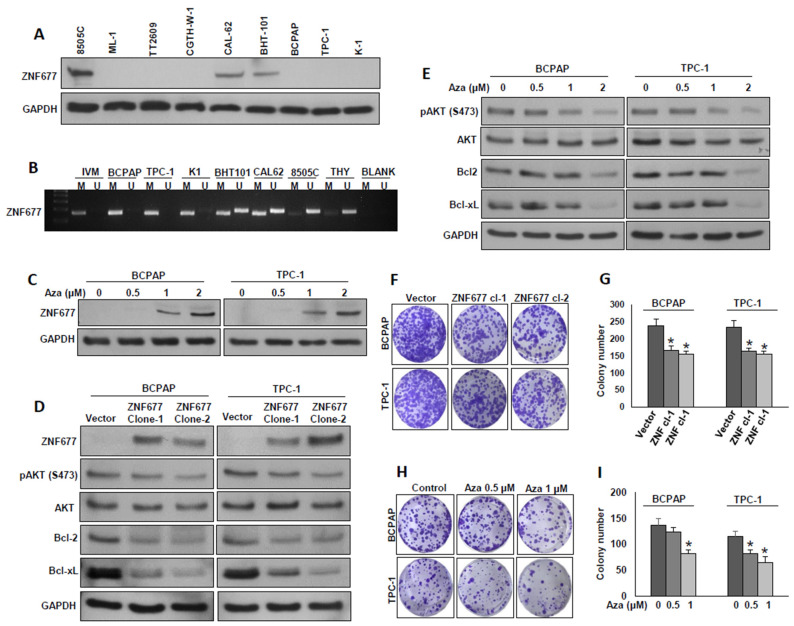
Figure 3.
ZNF677 inhibits PTC cell growth in vitro. (A) Basal expression of ZNF677 in a panel of thyroid cancer cell lines. Proteins were isolated from nine thyroid cancer cell lines and immunoblotted with antibodies against ZNF677 and GAPDH (n = 3). (B) Methylation status of thyroid cancer cell lines assessed by methylation-specific PCR for the ZNF677 gene. MSP analyses of both methylated (M) and unmethylated (U) reactions were amplified from bisulfite-treated DNA and run in a 2% agarose gel. Distinguishable unmethylated (8505C), methylated (BCPAP, TPC-1, and K1), and partially methylated (BHT-101 and CAL62) bands can be seen in the gel. (C) Demethylation of the ZNF677 gene restored ZNF677 expression in BCPAP and TPC-1 cells. PTC cells were treated with different doses (0.5, 1, and 2 µM) of 5-aza-2′deoxycytidine for 72 h before lysis. Equal amounts of proteins were immunoblotted with antibodies against ZNF677 and GAPDH (n = 3). (D) Ectopic expression of ZNF677 downregulates AKT phosphorylation and anti-apoptotic protein expression. BCPAP and TPC-1 cells were transfected with either empty vector or with ZNF677 cDNA, and overexpressing clones were selected and immuno-blotted with antibodies against ZNF677, pAKT, AKT, Bcl-2, Bcl-xL, and GAPDH as indicated (n = 3). (E) Demethylation of ZNF677 gene downregulates AKT phosphorylation and anti-apoptotic protein expression. PTC cells were treated with the indicated doses of 5-aza-2′deoxycytidine for 72 h before lysis. Equal amounts of proteins were immunoblotted with antibodies against pAKT, AKT, Bcl2, Bcl-xL, and GAPDH (n = 3). (F,G) Forced expression of ZNF677 decreases clonogenicity. ZNF67- overexpressing clones were seeded at a density of 500 cells per well in a 6-well plate and grown for an additional 10 days, then stained with crystal violet, and colonies were counted. (H,I) Demethylation of ZNF677 gene decreases clonogenicity. PTC cells (500 cells per well in a 6-well plate) were treated with the indicated doses of 5-aza-2′deoxycytidine for 72 h and grown for an additional 10 days, then stained with crystal violet, and colonies were counted. Data presented in the bar graphs are the mean ± SD of three independent experiments (n = 3). * Indicates a statistically significant difference compared to control with p < 0.05.

