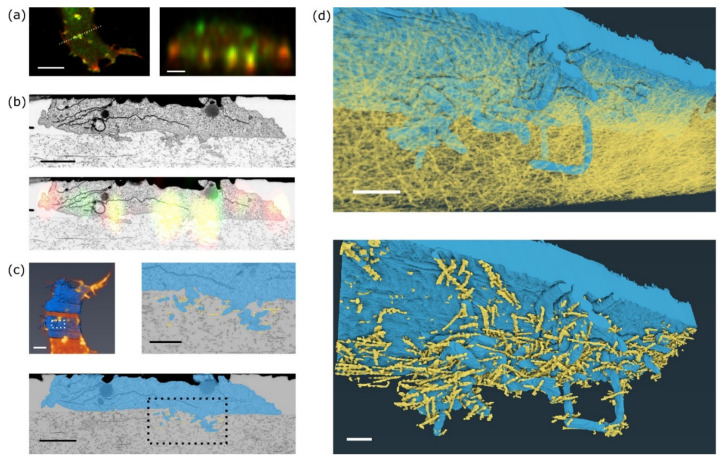
Figure 4.
Data correlation and segmentation of invadopodia. (a) Position (left) and single xz slice (right) used for correlation between EM and LM data. Scale bars 10 µm (left), 2 µm (right). (b) Top: EM slice from FIB-SEM used for EM and FM correlation. Bottom: Overlay of LM and EM single slice showing overlap between invadopodia resolved in detail (EM) and localisation of MT1-MMP-GFP signal from live-cell imaging. Scale bar 2 µm. (c) Top left: 3D overlay of FIB-SEM data after alignment and segmentation (in blue) with actin-fluorescence (orange). Top right: Detailed view of segmentation of selected invadopodia (blue) growing into collagen fibres in direct contact with them, shown in yellow. Bottom: Overview of shape segmentation in a single slice from FIB-SEM. Dotted box marks area of detailed view shown in Top right. Scale bar 5 µm (top left), 1 μm (top right), 2 µm (bottom). (d) 3D projection of a detailed segmented invadopodium (cell shape in blue). Top: invadopodium (blue) inside a collagen meshwork (yellow). Bottom: collagen fibres in direct contact with cellular surface (yellow). Scale bar 1 μm (top), 500 nm (bottom).

