Figure 1.
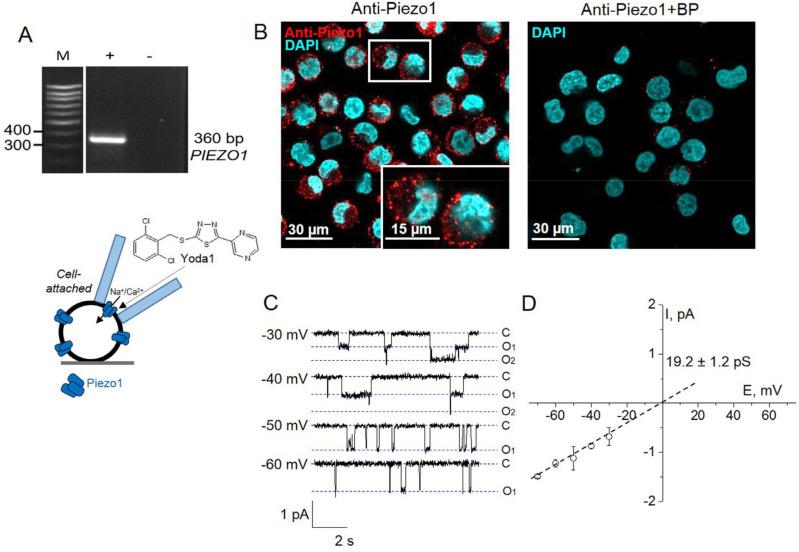
Piezo1 is expressed in human leukemia K562 cells. (A) RT-PCR analysis revealed the presence of hPIEZO1 mRNA. Cropped gel with enhanced contrast is shown. (B) Immunofluorescent staining with specific antibodies detected Piezo1 proteins (Anti-Piezo1, red channel) in the cells. Cell nuclei were counterstained with DAPI (blue channel). Cells in white frame are shown in 2× zoom. No staining of the cells was observed after pre-incubation of the anti-Piezo antibody with the specific corresponding blocking peptide (Anti-Piezo+BP). (C) The single-channel activity of Piezo1 induced by Yoda1 (10 µM in the pipette solution) recorded in the representative cell-attached experiment at different membrane potentials. Here and elsewhere, the index shows a number of active channels (C—closed state (zero current), O—channel openings). Holding membrane potential is indicated near current traces. (D) The mean I-V relationship corresponds to a single-channel conductance of 19.2 ± 1.2 pS (n = 9).

