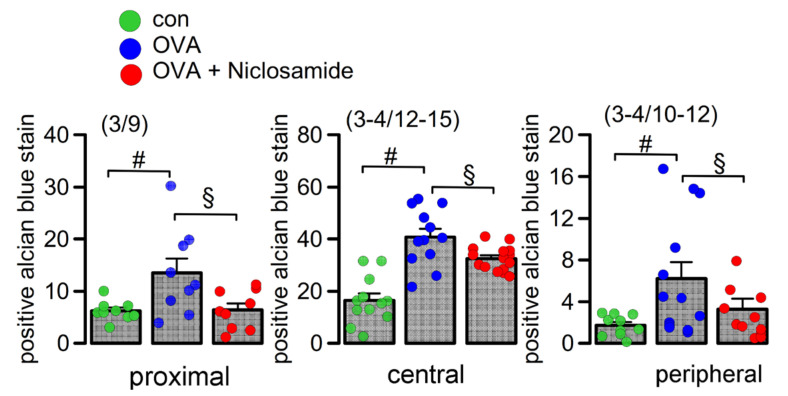
Figure 4.
Quantification of airway mucus. Quantification of mucus in proximal, central, and peripheral airways. Mean ± SEM (Number of mice/number of airways analyzed). # significant difference when compared to control (p < 0.05, ANOVA). § significant difference when compared to OVA (p < 0.05, ANOVA).

