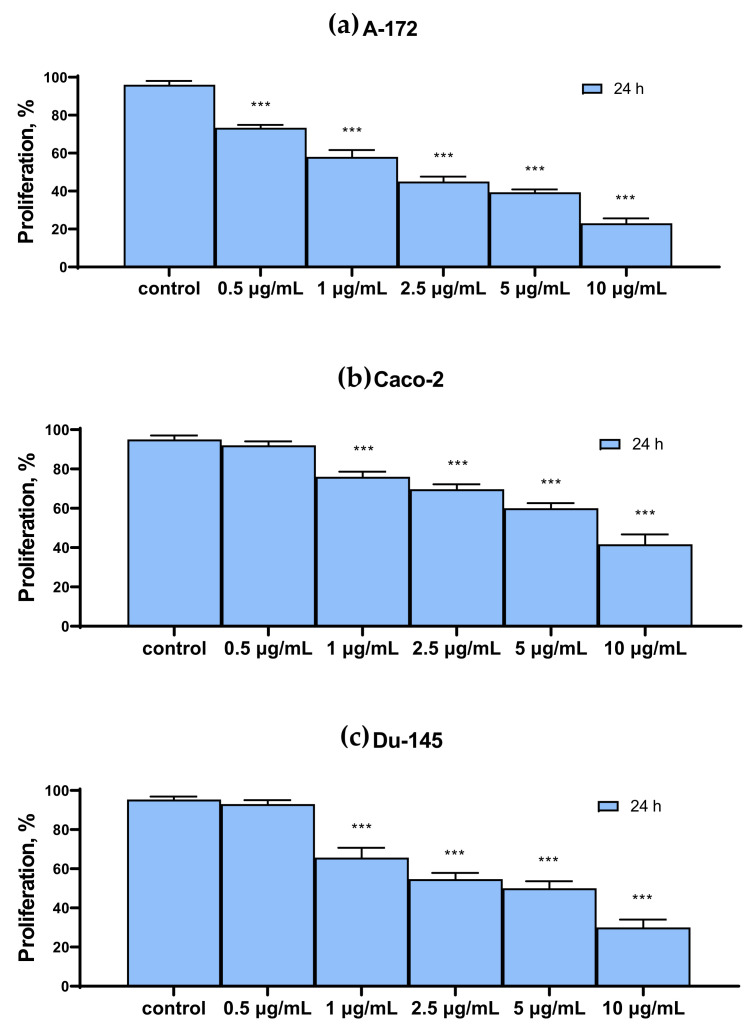
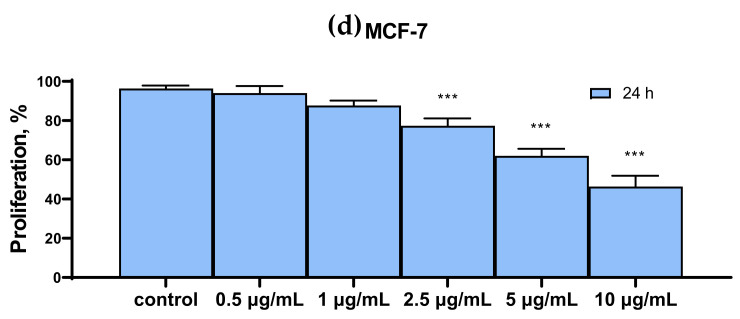
Figure 2.
MTT cell proliferation assay of intact cells and SeNP-treated cells for 24 h (a)—A-172; (b)—Caco-2; (c)—Du-145; (d)—MCF-7. Data are expressed as percentage of control (intact cells; set to 100). Each value is the mean ± SD (n ≥ 3, p < 0.05). One-way ANOVA with Sidak’s multiple comparisons test. Comparison with control, *** p-level < 0.001.


