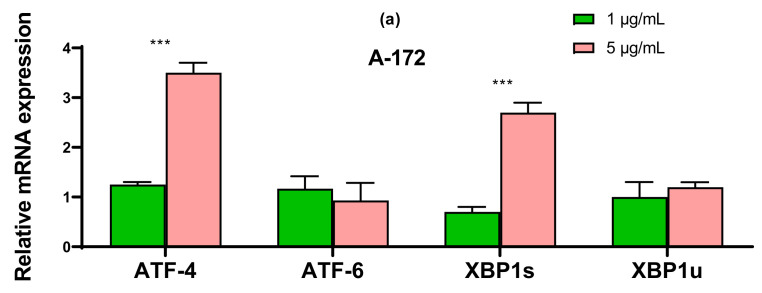
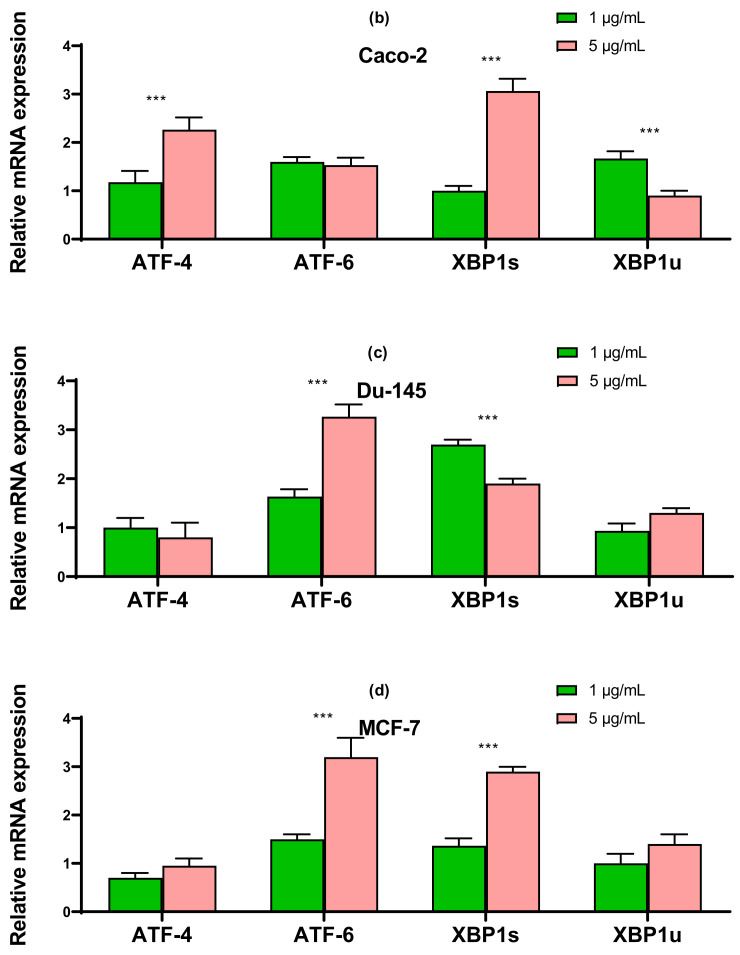
Figure 5.
qRT PCR analysis of the expression of ER stress response in gene (1 and 5 μg/mL SeNP, 24 h)-treated cancer cells (a)—A-172; (b)—Caco-2; (c)—Du-145; (d)—MCF-7. Each value is the mean ± SD of at least three independent experiments (n ≥ 3, p < 0.05). GAPDH was used as an internal control for normalization. Two-way ANOVA with Sidak’s multiple comparisons test. Comparison 1 μg/mL and 5 μg/mL, *** p-level < 0.001.


