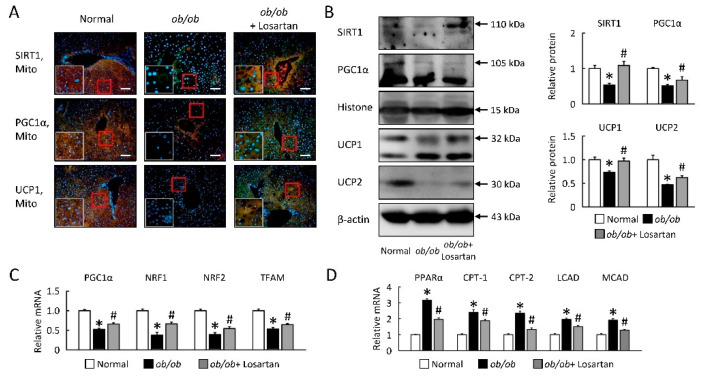
Figure 4.
Losartan enhanced mitochondrial biogenesis and function in ob/ob mice. (A) The staining for SIRT1, PGC1α, and UCP1 are green, while the staining for mitochondria (Mito Tracker) is red. Staining for DAPI is blue. Magnification of tissue samples is 20× (red box) and for inset, magnification is 40× (white box). Scale bar: 100 μm. (B) Quantification of SIRT1, PGC1α, UCP1, and UCP2 protein levels by Western blot of liver after losartan treatment. Right graphs indicate quantification relative to Histone (for SIRT1 and PGC1α) and β-actin (for UCP1 and UCP2). Quantification of (C) PGC1α, NRF1, NRF2, TFAM, (D) PPARα, CPT-1, CPT-2, LCAD, and MCAD by qRT-PCR. qRT-PCR indicate quantification relative to GAPDH. For each animal group, n = 5. All values represent the mean ± SEM. Data were analyzed by Student’s t test. * p ≤ 0.05; normal vs. ob/ob. # p ≤ 0.05; ob/ob vs. ob/ob + Losartan. SIRT1, sirtuin-1; PGC1α, peroxisome proliferator-activated receptor gamma coactivator 1-alpha; PPAR, peroxisome proliferator-activated receptor; UCP1, uncoupling protein 1; NRF, nuclear respiratory factor; TFAM, mitochondrial transcription factor A; CPT, carnitine palmitoyltransferase; LCAD, long-chain acyl-CoA dehydrogenase; MCAD, medium-chain acyl-CoA dehydrogenase.

