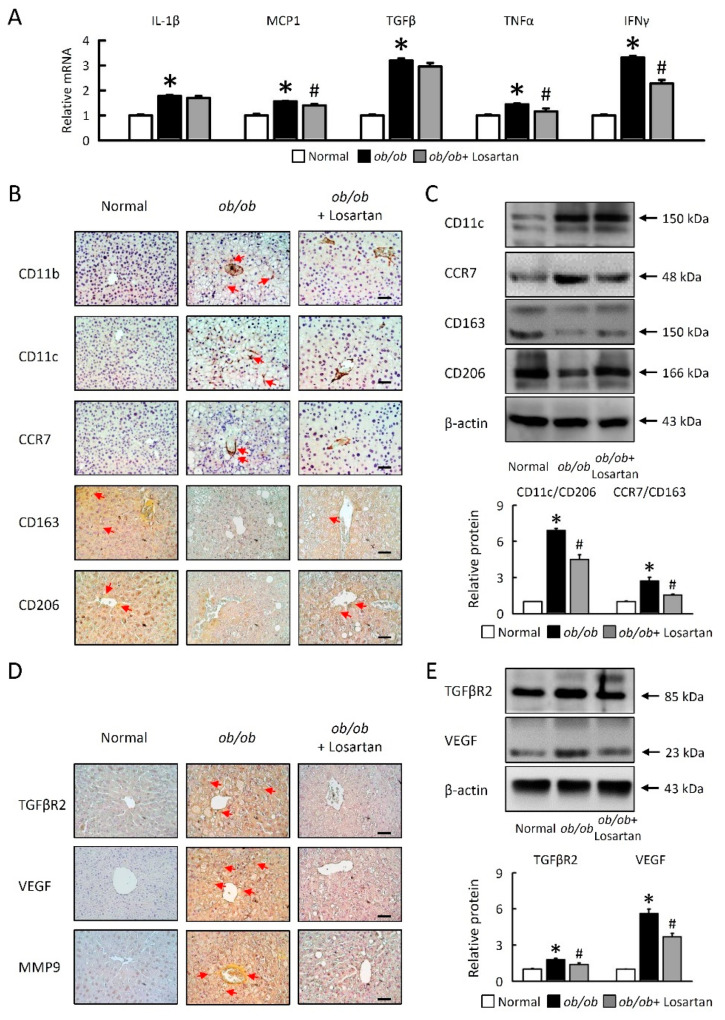
Figure 5.
Losartan related macrophage polarization and angiogenesis in liver. (A) Quantification of IL-1β, MCP-1, TGFβ, TNFα, and IFNγ by qRT-PCR. qRT-PCR indicates quantification relative to GAPDH. (B) Representative CD11b, CD11c, CCR7, CD163 and CD206 staining of liver. Red arrow highlights the positive staining. Scale bar: 100 μm. (C) Quantification of CD11c, CCR7, CD163, and CD206 protein levels by Western blot of liver. Below graphs indicate quantification relative to β-actin. Ratio of CD11c at CD206 and CCR7 at CD163 in liver. (D) Representative TGFβR2, VEGF, and MMP9 staining of liver. Red arrow highlights the positive staining. Scale bar: 100 μm. (E) Quantification of TGFβR2 and VEGF protein levels by Western blot of liver. Below graphs indicate quantification relative to β-actin. For each animal group, n = 5. All values represent the mean ± SEM. Data were analyzed by Student’s t test. * p ≤ 0.05; normal vs. ob/ob. # p ≤ 0.05; ob/ob vs. ob/ob + Losartan. IL-1β, interleukin-1β; MCP-1, monocyte chemoattractant protein-1; TGFβ, transforming growth factor beta; TNFα, tumor necrosis factor α; IFNγ, interferon gamma; TGFβR2, transforming growth factor beta receptor 2; VEGF, targets vascular endothelial growth factor; MMP9, matrix metallopeptidase 9.

