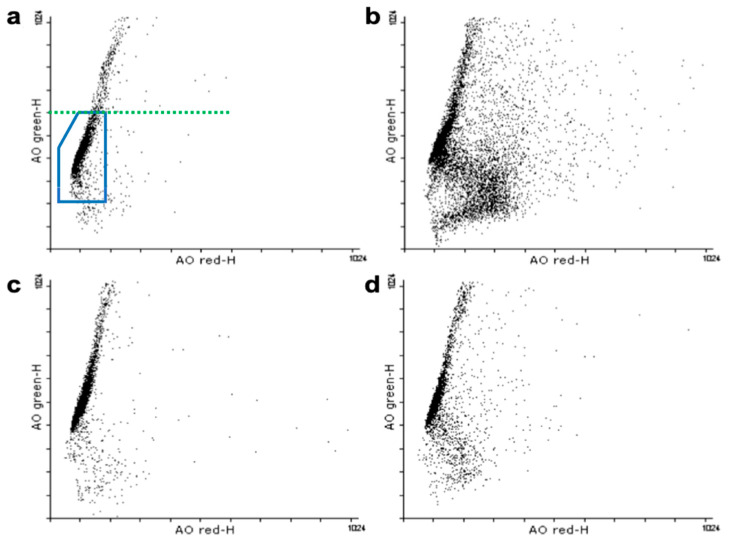
Figure A1.
Results of the flowcytometric measurements (SCSA). Detection of green fluorescence is shown on the y-axis, detection of red fluorescence on the x-axis. The main sperm population is marked blue in (a), sperm outside this region on the right exhibit elevated amounts of DNA fragmentation. High DNA stainability can be found above the green line shown in (a). (a,b) represent CP/CPPS patient samples, (c,d) samples of the control group. (a): CP/CPPS with very low amounts of sperm with DNA fragmentation. (b): CP/CPPS with high amounts of sperm with DNA fragmentation. (c): control with very low amounts of sperm with DNA fragmentation. (d): control with high amounts of sperm with DNA fragmentation.

