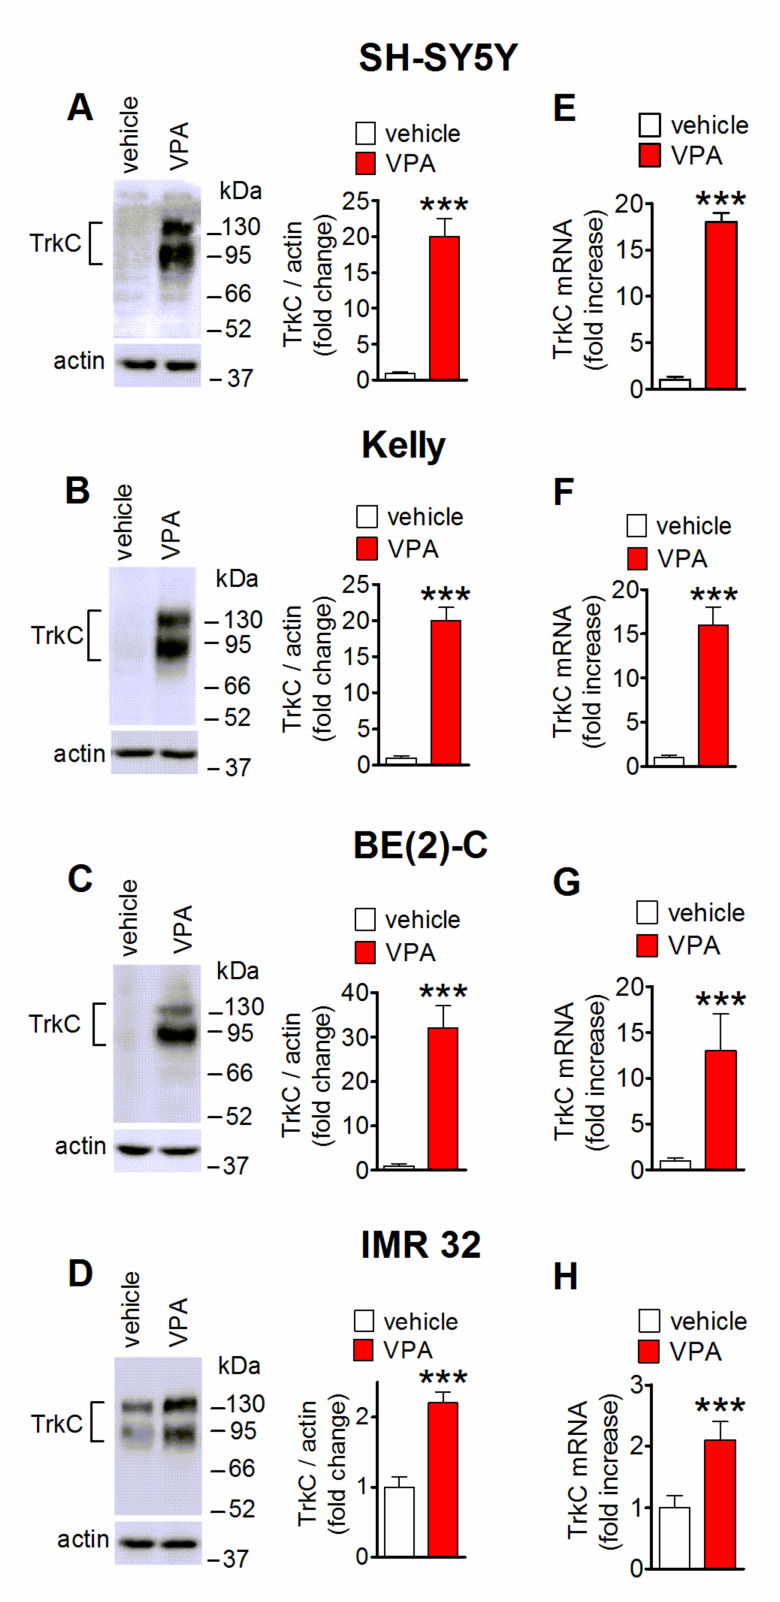
Figure 1.
VPA upregulates TrkC expression in human neuroblastoma cell lines. (A–D) Cells were treated with either vehicle or 1 mM VPA for 24 h and then analyzed for TrkC protein levels by Western blot. Values are the mean ± SD of five (A) and four (B–D) independent experiments. The position of molecular mass standards is indicated on the right side of each blot. (E–H) Quantitative real-time reverse transcription polymerase chain reaction (qRT-PCR) analysis of TrkC mRNA in cells treated for 24 h with either vehicle or 1 mM VPA. Values are the mean ± SD of four independent experiments. *** p < 0.001 vs. control (vehicle-treated cells) by Student’s t test.

