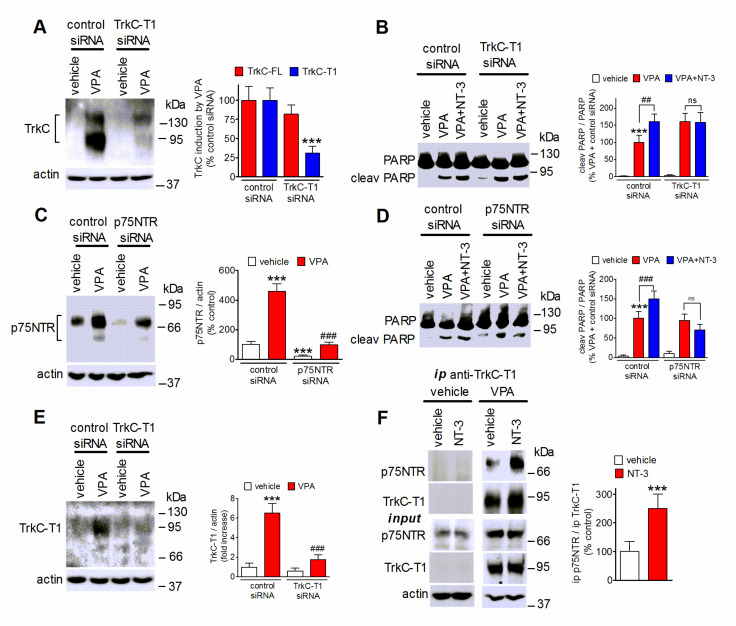
Figure 8.
TrkC-T1 and p75NTR mediate NT-3 potentiation of VPA-induced apoptosis. (A,C) SH-SY5Y cells were transfected with either control siRNA, TrkC-T1 siRNA, or p75NTR siRNA and then treated for 24 h with either vehicle or 1 mM VPA. Cell lysates were analyzed for TrkC-FL and TrkC-T1 (A), and p75NTR (C). Values are the mean ± SD of four independent experiments. *** p < 0.001 vs. control (control siRNA + vehicle); ### p < 0.001 vs VPA in control siRNA-treated cells. (B,D) Cells transfected as in (A,C) were preincubated for 24 h with either vehicle or 1 mM VPA and then exposed in serum-free medium to either vehicle or 0.3 nM NT-3 for 24 h. Cell lysates were analyzed for PARP cleavage. Values are the mean ± SD of four independent experiments. *** p < 0.001 vs. control (control siRNA + vehicle); ## p < 0.01, ### p < 0.001; ns, p > 0.05. (E) Cells were transfected and treated as in (A) and cell lysates were analyzed for TrkC-T1 expression by using a TrkC-T1 specific antibody. Values are the mean ± SD of four independent experiments. *** p < 0.001 vs. control (control siRNA + vehicle); ### p < 0.001 vs. VPA in control siRNA-treated cells by ANOVA followed by Tukey’s test. (F) SH-SY5Y cells pretreated for 24 h with either vehicle or 1 mM VPA were then exposed for 1 h to NT-3 (1.0 nM) in serum-free medium. Cell extracts were then subjected to immunoprecipitation (ip) with anti-TrkC-T1 antibody. Cell extracts (input) and immunoprecipitates were analyzed for p75NTR and TrkC-T1 levels. Values refer to the densitometric ratios of p75NTR over TrkC-T1 in immunoprecipitates of VPA-treated cells and are the mean ± SD of four independent experiments. *** p < 0.001 vs. control (VPA + vehicle) by Student’s t test.

