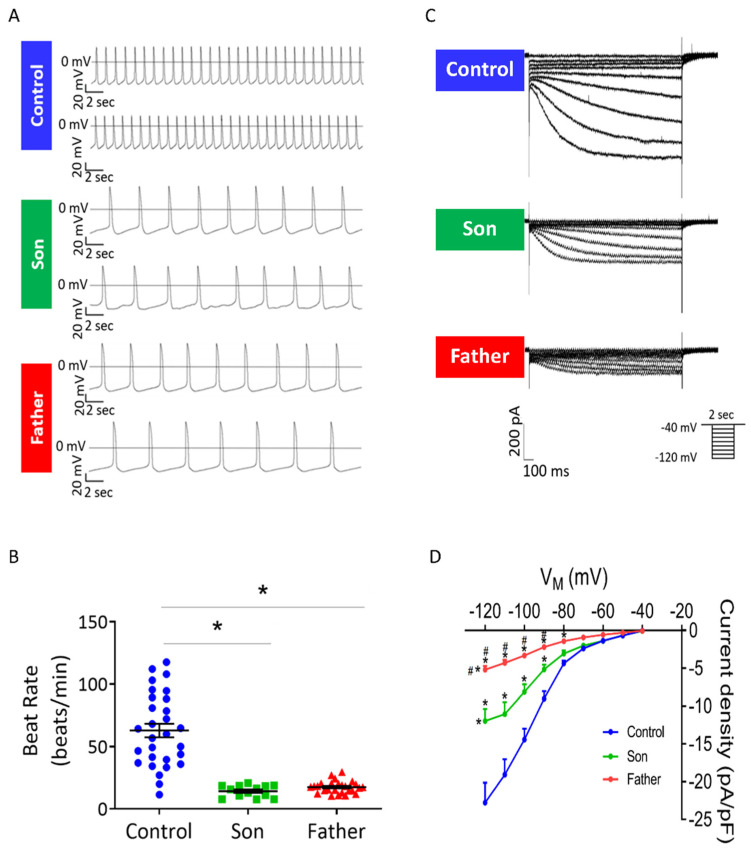
Figure 3.
Spontaneous beat rate and If in control, father and son iPSC-CMs. (A) Representative spontaneous action potentials recorded from control, father and son iPSC-CMs. (B) Mean beat rate of control, father and son iPSC-CMs. control (FSE-5 m and 24.5), n = 30; son, n = 14; father, n = 27. One-way ANOVA was performed followed by Holm–Sidak post hoc analysis. * p < 0.05. (C) Representative recordings of If in control, father and son iPSC-CMs. (D) If current–voltage (I–V) relations in control and LMNA-mutated iPSC-CMs. Control (FSE-5 m), n = 8; son, n = 10; father, n = 18. Two-way ANOVA was performed followed by Holm–Sidak post hoc analysis. * p < 0.05 vs. control; # p < 0.05 vs. son.

