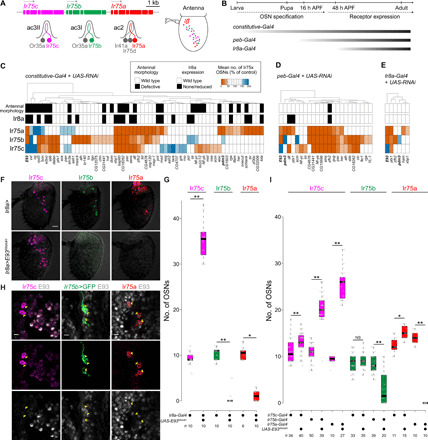
Fig. 1. RNAi screens identify roles for E93 in repression and activation of Ir expression.

(A) Schematics of Ir75c, Ir75b, and Ir75a (arrows indicate the direction of transcription), the corresponding antennal coeloconic (ac) sensillar neurons, and their antennal distribution (10). (B) Schematics of the phases of OSN development and the temporal expression patterns of the RNA interference (RNAi) screen Gal4 drivers. (C) Hits from the constitutive-Gal4 RNAi screen. At least three antennae were scored for each line [see tables S1 to S7 for data for (C) to (E)]. For Ir75a/b/c neuron numbers, an RNAi line was considered to give a phenotype if there were less than half, or more than 1.5×, the numbers of cells in controls (as illustrated by the heatmap). Euclidian distance was used for the hierarchical clustering in (C) to (E). Control genotype: ey-FLP,Act5c(FRT-CD2)-Gal4/+. (D) Hits from the peb-Gal4 RNAi screen. Control genotype: peb-Gal4,UAS-Dcr-2/+. (E) Hits from the Ir8a-Gal4 RNAi screen. Control genotype: Ir8a-Gal4/+. (F) Representative images of Ir75c, Ir75b, and Ir75a immunofluorescence (on a bright-field background) in control (Ir8a-Gal4/+) and E93RNAi (Ir8a-Gal4/UAS-E93RNAi#1) antennae. Scale bar, 20 μm. (G) Quantification of neuron numbers in the genotypes shown in (F). Boxplots show the median, first, and third quartile of the data, overlaid with individual data points. Pairwise Wilcoxon rank sum test: **P < 0.001 and *P < 0.05. The sample size is shown beneath the plot. (H) Representative images of immunofluorescence on antennal sections for E93 and Ir75c or Ir75a in w1118 flies, or E93 and green fluorescent protein (GFP) in Ir75b-Gal4/+;UAS-myr:GFP/+ animals. Yellow arrowheads indicate the soma. Scale bars, 5 μm. (I) Quantification of neuron numbers in control and Ir OSN-targeted E93RNAi antennae. Genotypes: UAS-myr:GFP/+;Ir75c-Gal4/+, UAS-myr:GFP/+;Ir75c-Gal4/UAS-E93RNAi#1, Ir75b-Gal4/+;UAS-myr:GFP/+, Ir75b-Gal4/+;UAS-myr:GFP/UAS-E93RNAi#1, Ir75a-Gal4/+;[UAS-myr:GFP or +]/+, and Ir75a-Gal4/+;[UAS-myr:GFP or +]/UAS-E93RNAi#1 (GFP signal was not used in any quantifications). Pairwise Wilcoxon rank sum test: **P < 0.001 and *P < 0.05; NS, P > 0.05.
