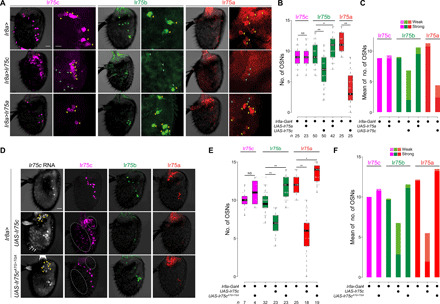
Fig. 3. Posttranscriptional inhibition of Ir75a and Ir75b by Ir75c protein.

(A) Representative images of Ir75c, Ir75b, and Ir75a immunofluorescence in antennae of control (Ir8a-Gal4/+), Ir75c misexpression (Ir8a-Gal4/UAS-Ir75c), and Ir75a misexpression (Ir8a-Gal4/UAS-Ir75a) animals. Scale bar, 20 μm. A region of interest is shown at higher magnification to the right of each image. Scale bar, 10 μm. Yellow and cyan arrowheads indicate neurons with strong and weak receptor expression, respectively. (B) Quantification of neuron numbers in the genotypes shown in (A) (Ir75a quantification in Ir8a>Ir75a antennae and Ir75c quantification in Ir8a>Ir75c antennae are not shown, as neuron density, comprising the entire Ir8a population, is too high for unambiguous scoring). Pairwise Wilcoxon rank sum test and P values adjusted for multiple comparisons with the Bonferroni method: **P < 0.001 and *P < 0.05; NS, P > 0.05. (C) Quantification of the mean number of neurons with strong and weak immunofluorescence signals [see arrowheads in (A)] in the genotypes shown in (A). (D) Representative images of Ir75c RNA FISH and Ir75c, Ir75b, and Ir75a immunofluorescence in antennae of control (Ir8a-Gal4/+), Ir75c misexpression (Ir8a-Gal4/UAS-Ir75c), and Ir75cATG>TGA misexpression (Ir8a-Gal4/UAS-Ir75cATG>TGA) animals. Yellow arrowheads indicate examples of neurons expressing Ir75c RNA ectopically. Ectopic Ir75c protein signal is detected only in antennae expressing UAS-Ir75c but not UAS-Ir75cATG>TGA (e.g., in regions highlighted with dashed ovals). Scale bar, 20 μm. (E) Quantification of neuron numbers in the genotypes shown in (D) (Ir75c quantification for Ir8a>Ir75c antennae is not shown, as neuron density, comprising the entire Ir8a population, is too high for unambiguous scoring). Pairwise Wilcoxon rank sum test and P values adjusted for multiple comparisons with the Bonferroni method: **P < 0.001 and *P < 0.05; NS, P > 0.05. It is unknown why Ir75b and Ir75a neuron numbers increase slightly upon expression of UAS-Ir75cATG>TGA. (F) Quantification of the number of neurons with strong and weak immunofluorescence signals in the genotypes shown in (D).
