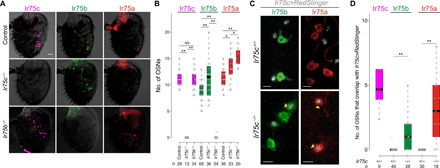
Fig. 5. Ectopic expression of Ir75b and Ir75a in Ir75c mutant neurons.

(A) Representative images of Ir75c, Ir75b, and Ir75a immunofluorescence in control (w1118), Ir75c−/− (Ir75cMB08510/Ir75cMB08510), and Ir75b−/− (Ir75bDsRed/Ir75bDsRed) antennae. Scale bar, 20 μm. (B) Quantification of neuron numbers in the genotypes shown in (A). Pairwise Wilcoxon rank sum test and P values adjusted for multiple comparisons with the Benjamini and Hochberg method: **P < 0.001 and *P < 0.05; NS, P > 0.05. (C) Representative images of Ir75b and Ir75a immunofluorescence for a subset of Ir75c neurons [labeled with RedStinger (gray)] in Ir75c+/− and Ir75c−/− antennae. Yellow arrowheads mark Ir75c−/− neurons that ectopically express Ir75b or Ir75a. Genotypes: UAS-RedStinger/+;Ir75c-Gal4,Ir75cMB08510/+ and UAS-RedStinger/+;Ir75c-Gal4,Ir75cMB08510/Ir75cMB08510. Scale bars, 5 μm. (D) Quantification of Ir75c neurons that ectopically express Ir75b or Ir75a in Ir75c+/− and Ir75c−/− flies [genotypes as in (C)]. Pairwise Wilcoxon rank sum test and P values adjusted for multiple comparisons with the Bonferroni method: **P < 0.001. In the control Ir75c immunofluorescence samples, all neurons [81 of 81 (100%)] express both Ir75c and Ir75c>RedStinger. Ectopic expression of Ir75b and Ir75a in Ir75c−/− neurons appeared to be mutually exclusive [only 1 of 18 (5.5%) neurons expressed both of these receptors, presumably, in part, due to the repressive effect of Ir75b expression on Ir75a (Fig. 4)].
