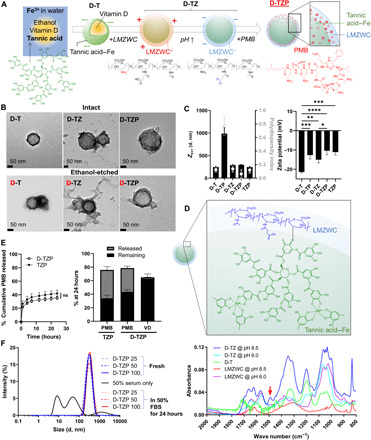
Fig. 1. Development and characterization of D-TZP.

(A) Schematic of D-TZP preparation. D-TZP was formed by encapsulating vitamin D in TA and Fe3+ complexation and then coated with LMZWC and PMB sequentially. D-T, self-assembly of TA/Fe3+ coordination complex containing vitamin D; D-TZ, D-T coated with LMZWC; D-TZP, D-T coated with LMZWC and PMB. (B) Transmission electron micrographs of intact D-T, D-TZ, and D-TZP (top), and ethanol-etched D-T, D-TZ, and D-TZP (bottom). (C) z-average diameter (Zavr), polydispersity index, and zeta potential of nanoparticles at pH 7.4 (10 mM phosphate buffer). The data are shown as means ± SD (n = 3 independently and identically prepared batches). Statistical significance was accessed by Tukey’s multiple comparisons test following ordinary one-way ANOVA (*: p < 0.05; **: p < 0.01; ***: p < 0.001; and ****: p < 0.0001). (D) Schematic of LMZWC binding to TA/Fe3+ assembly (top). Fourier transform infrared spectra of LMZWC at pH 6.0, LMZWC at pH 8.5, D-T and D-TZ at pH 6.0, and D-TZ at pH 8.5 (bottom). (E) In vitro PMB release from D-TZP and TZP in 50% fetal bovine serum (FBS) at 37°C (left). Statistical significance was accessed by Sidak’s multiple comparisons test following two-way analysis of variance (ANOVA) (ns, no significant difference). The data are shown as means ± SD (n = 3 independently and identically prepared batches). Recovery of PMB from D-TZP and TZP after 24-hour incubation in 50% FBS (right). The data are shown as means ± SD (n = 3 independently and identically prepared batches). (F) Size distribution of fresh D-TZP and D-TZP incubated in 50% FBS (at concentrations equivalent to 25 to 100 μg/ml PMB) for 24 hours at 37°C.
