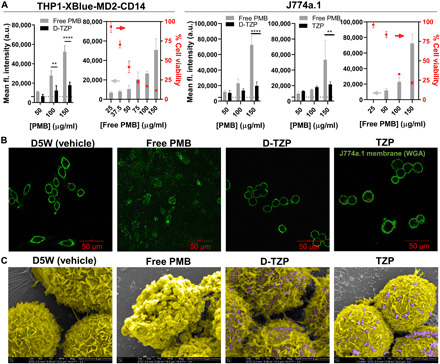
Fig. 2. D-TZP reduces toxicity of PMB.

(A) Mean fluorescence intensity of PI-stained THP1-XBlue-MD2-CD14 cells and J774A.1 macrophages after 24-hour incubation with D-TZP, TZP, or free PMB. The dotted lines represent background fluorescence intensity of nontreated control cells. The cell viability measured by MTT assay (dots) was plotted alongside to correlate with PI fluorescence intensity (bars). Statistical significance was accessed by Sidak’s multiple comparisons test following two-way ANOVA (**P < 0.01 and ****P < 0.0001). The data are shown as means ± SD (n = 3 independently and identically prepared batches). (B) Confocal images of J774A.1 macrophages treated with D5W (vehicle), free PMB, TZP, or D-TZP for 12 hours at a concentration equivalent to 150 μg/ml PMB. Green signals indicate the membrane of macrophages stained with wheat germ agglutinin–Alexa Fluor 488 conjugate. (C) Scanning electron micrographs of J774A.1 macrophages treated with D5W, free PMB, TZP, or D-TZP for 12 hours at a concentration equivalent to 150 μg/ml PMB. Images are artificially colored to identify J774A.1 macrophages (yellow) and D-TZP (purple). a.u., arbitrary units.
