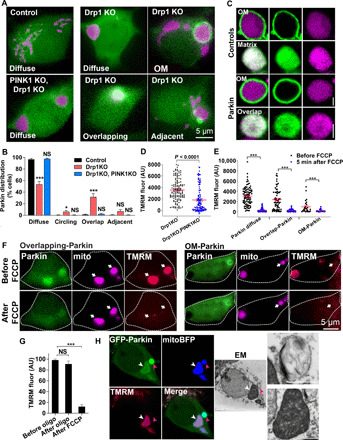
Fig. 3. Parkin is recruited into polarized Drp1KO mitochondria.

(A) Neurons expressing GFP-Parkin (green) and mitoBFP (purple, mitochondrial matrix–targeted BFP). Parkin is diffusely distributed in control neurons. A subset of Drp1KO neurons contain mitochondria with either adjacent Parkin punctae, overlapping Parkin, or Parkin ringing (circling). Drp1KO;PINK1KO blocks all Parkin recruitment. (B) Quantification of Parkin distribution patterns. Data show means ± SEM; n = 12 coverslips per group, 8 to 20 neurons per coverslip from three experiments. (C) Confocal microscopy shows single mitochondria in Drp1KO neurons expressing a mitochondrial matrix marker (mitoFarRed, purple) and either a mitochondrial outer membrane marker (OM-GFP) or mitochondrial matrix marker (matrix-GFP) as controls or GFP-Parkin recruited either in a mitochondrial OM or overlapping pattern. Scale bars, 1 μm. (D) Scattergraph of mitochondrial membrane potential (TMRM) of individual Drp1KO and Drp1KO;PINK1KO mitochondria. n = 128 to 130 mitochondria per group from two experiments. P < 0.0001 by unpaired t test. (E and F) Scattergraphs (E) and images (F) of mitochondrial membrane potential (TMRM, red) of mitochondria with different Parkin patterns in Drp1KO neurons expressing mitoBFP and GFP-Parkin, before and after FCCP treatment (1.25 μM). n = 26 to 87 mitochondria per group from three experiments. (G) Mitochondrial membrane potential (TMRM) of mitochondria with overlapping-Parkin in Drp1KO neurons before and after oligomycin (5 μM, 5 min) and FCCP (1.25 μM, 5 min). n = 17 cells from two experiments. *P < 0.05 and ***P ≤ 0.001 by one-way ANOVA with Tukey’s multiple comparisons test (G) or Games-Howell post hoc test (B and E). (H) CLEM showing GFP-Parkin accumulation in polarized (white arrowheads) and depolarized (pink arrowheads) mitochondria. Corresponding ultrastructure shows that the polarized mitochondrion with internalized Parkin has intact membranes and cristae (bottom inset), while the depolarized mitochondria (top inset) is a vesicular structure containing degraded mitochondrial membranes. Scale bars, 2 μm (main panels) and 1 μm (inset). AU, arbitrary units.
