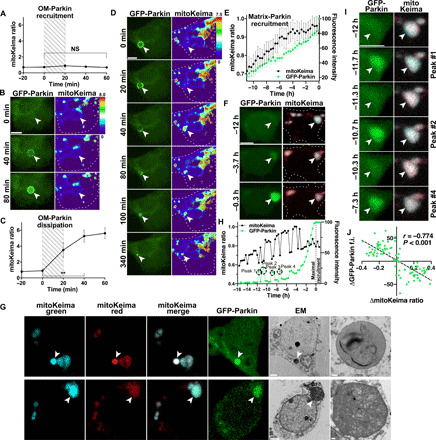
Fig. 4. Time-lapse imaging reveals distinct Parkin-dependent quality control pathways.

Drp1KO neurons coexpressing GFP-Parkin and mitoKeima were imaged every 20 min for up to 21 hours. (A) Relative mitochondrial acidity during OM-Parkin recruitment. Hatched area represents period of GFP-Parkin OM accumulation. Data represent means ± SEM. n = 10 mitochondria from 9 neurons, 1 to 4 neurons per dish, three experiments. (B) GFP-Parkin accumulates at the OM of a mitochondrion with low acidity. (C) Mitochondrial acidity during OM GFP-Parkin dissipation. Hatched area delineates period when GFP-Parkin begins to dissipate. n = 10 mitochondria from 9 neurons, 1 to 4 neurons per dish, two experiments. **P < 0.01 by one-way ANOVA with repeated measures. (D) OM-Parkin dissipates concomitantly with mitochondrial acidification. Parkin then accumulates inside the shrunken mitochondrion. (E) Direct matrix-Parkin accumulation. GFP-Parkin (green) slowly accumulates in the mitochondrial matrix as acidity (black) increases. GFP-Parkin fluorescence was normalized such that the lower and upper bounds were defined by the nuclear and maximum mitochondrial intensities, respectively. Traces are aligned so maximum matrix-Parkin intensity is at 0 hours. n = 23 mitochondria from 22 neurons, 1 to 9 neurons per dish, seven experiments. (F) GFP-Parkin directly accumulates in mitochondria, without prior OM recruitment. (G) CLEM shows that acidified overlapping-Parkin mitochondria are degrading mitochondrial contents within lysosomes (mitolysosomes) (top). Overlapping-Parkin mitochondria with slightly acidic pH (fig. S5F) are intact mitochondria with electron-dense cristae (bottom). Scale bars, 2 μm (cell overviews) and 0.2 μm (insets). (H and I) Corresponding repetitive single spikes of Parkin accumulation and decreased mitochondrial acidity in a Drp1KO mitochondrion during direct matrix-Parkin recruitment. (B, D, F, and I) Scale bars, 5 μm. (J) Inverse relationship between changes in GFP-Parkin intensity and mitoKeima ratio during Parkin spikes. The change in GFP-Parkin and mitoKeima was measured between time points before, during, and after the peak. n = 90 measurements, 40 individual spikes in 6 neurons, 5 to 9 spikes per neuron, 1 mitochondrion per neuron; Pearson r = −0.774, P < 0.001. f.i., fluorescence intensity.
