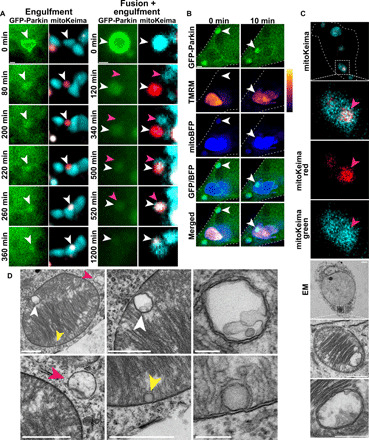
Fig. 6. Acidified overlapping-Parkin mitochondria are engulfed by mitochondria with normal pH.

Mitochondria in Drp1KO hippocampal neurons coexpressing GFP-Parkin and mitoKeima were tracked individually to determine their fates. (A) Time-lapse images show the fates of single mitochondria that were acidified following OM-Parkin disruption (white arrowheads). Some mitolysosomes are engulfed by nonacidified mitochondria (left). The mitolysosome on the right first fuses with a nonacidified mitochondrion (pink arrowheads) before being engulfed by another. Scale bars, 1 μm. (B) Drp1KO neurons expressing GFP-Parkin and mitoBFP were incubated with TMRM and imaged every 10 min for several hours. Representative images show overlapping-Parkin mitochondria being engulfed by polarized mitochondria (white arrowheads). Overlapping-Parkin colocalizes with mito-BFP before and after engulfment. Scale bar, 1 μm. (C) CLEM images show a healthy mitochondrion with intact cristae that contains a discrete acidified structure (by mitoKeima) that corresponds to a membrane-bound structure enclosing mitochondrial materials. Scale bars, 2 μm (cell overview), 1 μm (mitochondria overview), and 0.5 μm (inset). (D) EM images show a healthy mitochondrion engulfing two structures (white and yellow arrowheads) similar to what was described in (C). A lysosome (pink arrowheads) was also observed interacting with the same mitochondrion. Scale bars, 1 μm for images containing arrowheads and 0.2 μm for insets.
