FIGURE 5.

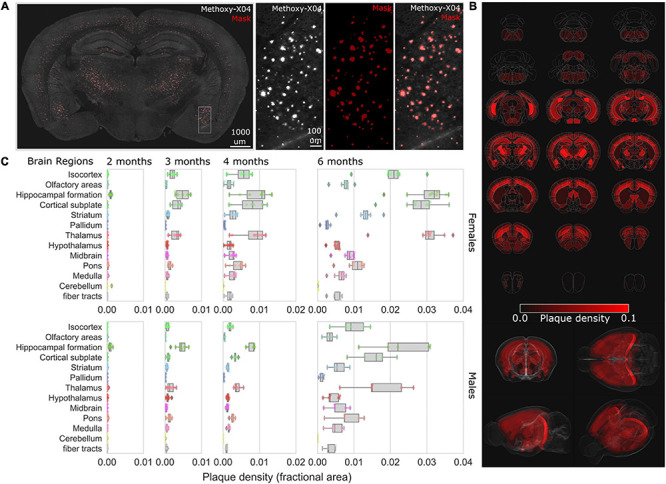
Mapping the progression of methoxy-X04 labeled plaque deposition across brain regions. (A) Example brain section from 4-month-old female 5XFAD with methoxy-X04 labeled (gray) and segmentation masked plaques (red overlay). Zoom inset depicts (left to right) methoxy-X04 signal, mask (red), methoxy-X04 signal with mask overlay. (B) Plaque densities (fractional area) were quantified for all brain regions depicted as average density heat maps (red) mapped across the entire Allen Mouse Brain Reference Atlas for 6-month-old female 5XFAD, visualized as evenly spaced selected coronal sections (top) and 3D renderings (bottom). (C) Box plots of the plaque densities for 13 major brain regions from 2-, 3-, 4-, and 6-month-old female (top) to male (bottom) cohorts demonstrate regional plaque density progression, plots depict median and interquartile range (IQR-25:75) whiskers depict 1.5× IQR, and diamonds for values outside the range.
