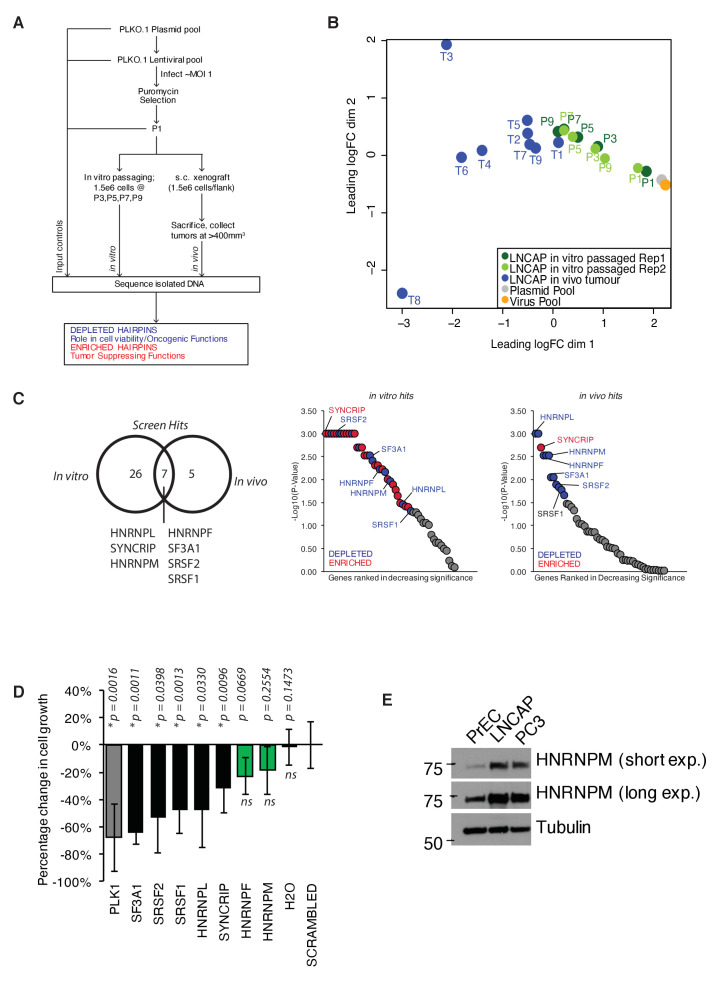
Figure 1. A pooled shRNA screen identifies HNRNPM as a regulator of prostate cancer (PCa) cell growth.
(A) Schematic of overall experimental design. (B) Multidimensional scaling (MDS) plot of individual samples (in vitro passaged cells and tumors) collected in the screen, in relation to each other. (C) Right: Venn diagram showing overlap of significant (p<0.05) hits for in vitro and in vivo screens. Left: ranked dotplots showing –log10(p-values) of in vivo and in vitro screen hits. Red circles represent significantly upregulated (enriched) hits, while blue circles represent significantly downregulated (depleted) hits. Tumor-specific hits are indicated. (D) Barplots showing overall prostate epithelial cell (PrEC) proliferation upon a 96 hr, siRNA-mediated knockdown of the indicated splicing factors, as measured through a colorimetric MTS assay. siRNAs that inhibit cell proliferation relative to the scrambled siRNA control are indicated in black, while siRNAs that do not alter cell proliferation are indicated in green. Each assay was performed in two biological replicates, with two technical duplicates per replicate. Error bars represent SD; *p<0.05 compared to scrambled. (E) Western blot of HNRNPM protein levels in PrEC, LNCAP, and PC3 cells. Tubulin is shown as a loading control.


