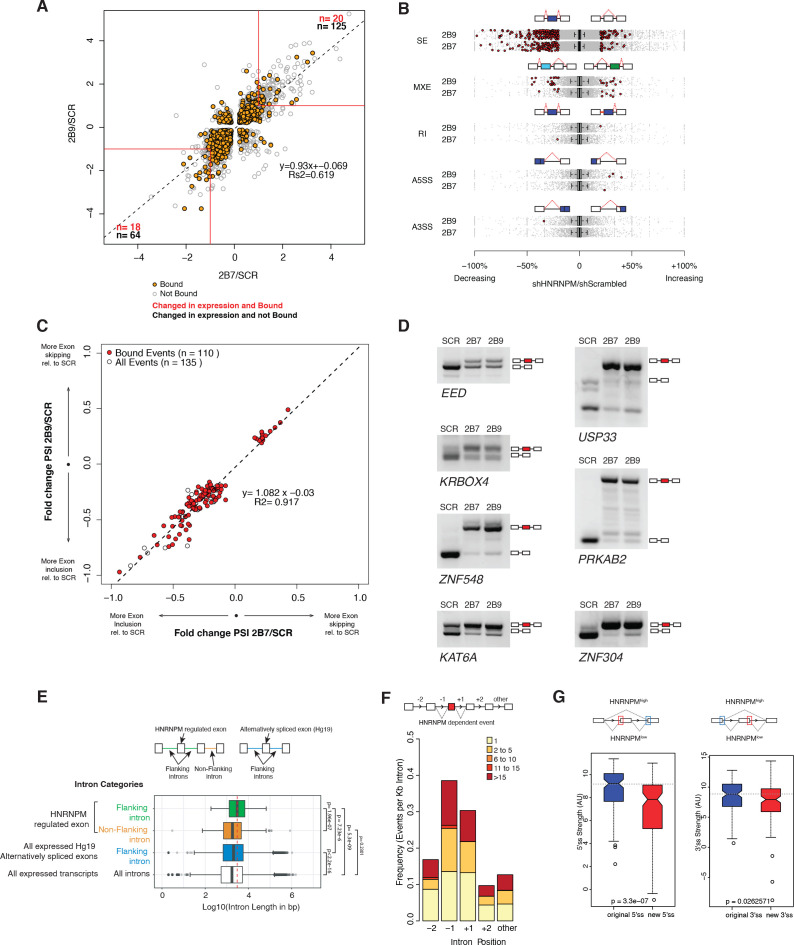
Figure 4. HNRNPM depletion results in increased exon inclusion.
(A) Scatterplot of all significantly changed (p<0.05, FDR < 0.05) genes (gray point) in HNRNPM shRNA-treated cells, and their HNRNPM-binding status. HNRNPM-bound genes are highlighted in orange. Red boxes denote a twofold change cutoff. The total numbers of differentially expressed genes (p<0.05, FDR < 0.05, fold change ≥ 2) are indicated in black, and the numbers of genes that are differentially expressed and bound by HNRNPM are indicated in red. (B) Plots showing all alternative splicing events occurring in HNRNPM shRNA-treated cells. All unique captured events are plotted in gray, while significantly changing events are shown in red. Change in percent spliced in (ΔPSI; HNRNPM shRNA [2B9] versus scrambled shRNA) for the captured events is shown on the x axis. RI: retained intron; A3SS: alternative 3′ splice site usage; A5SS: alternative 5′ splice site usage; MXE: mutually exclusive exons; SE: skipped exon. (C) Scatterplot of splicing events that are significantly changed (p<0.05, FDR < 0.05, |ΔPSI| > 0.2) in both HNRNPM shRNA (2B7 and 2B9) conditions. ΔPSI is calculated relative to scrambled shRNA-treated cells (SCR). Shown in red are events that occur in transcripts that are bound by HNRNPM. (D) RT-PCR validation of seven representative differentially spliced events that occur in HNRNPM-depleted cells. (E) Distribution of unique intron lengths in the introns flanking linear mis-splicing events (green) compared to that of other introns in the same transcript (orange). Shown also are distribution of lengths in introns flanking other alternatively spliced exons (blues) or all introns within expressed genes. Introns are plotted as Log10(length in base pairs). p-values were determined by Wilcoxon test. (F) Distribution of the numbers of HNRNPM-binding sites across the indicated introns in transcripts with linear mis-splicing events. (G) 5′ (right) and 3′ (left) splice site strength as compared to original, flanking splice sites in HNRNPM-dependent linear transcripts.

