. 2021 Jun 2;10:e59654. doi: 10.7554/eLife.59654

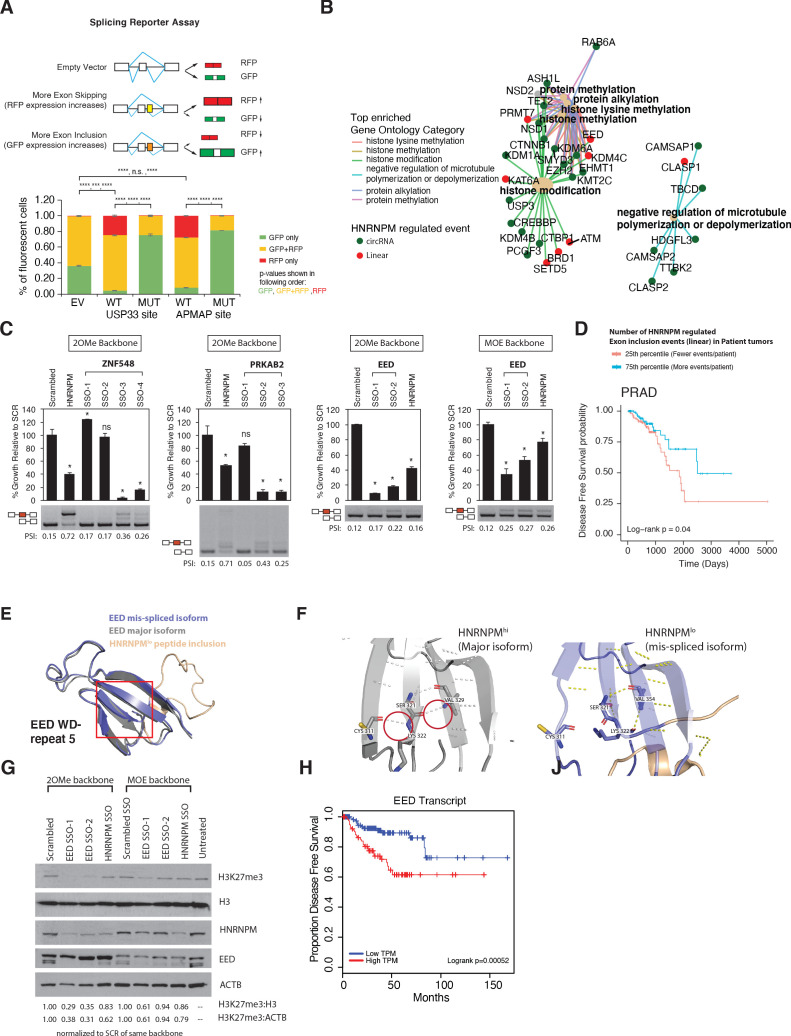
Figure 6. Mimicking HNRNPM-dependent linear-splicing events in cells inhibits exon inclusion and cell growth.

(A, top panel) Schematic showing outcomes of splicing reporter assay. Wildtype (WT) or mutant (MUT) HNRNPM-binding sites at the USP33 or APMAP genes and identified by eCLIP were cloned into a splicing reporter. The percentages of green fluorescent protein (GFP) (indicating exon inclusion) and dsRed fluorescent proteins (RFP) (indicting exon skipping) single- (green and red bars) and double-positive cells (yellow bars) out of all fluorescent cells are shown in a barplot in the lower panel. Shown are the mean and standard deviation of three experiments. Student’s t-test was used to calculate p-values between the indicated groups. Ns: not significant; ** p<0.01; **** p<0.0001. (B) Gene ontology analysis of transcripts that are either changed in expression or mis-spliced upon HNRNPM knockdown. Both mis-spliced circular (green dots) and linear (red dots) RNAs are shown. Top enriched gene ontology categories (yellow dots) and the genes present in each category are indicated with colored lines. (C) Cell proliferation and exon inclusion outcomes in splice-switching-antisense-oligonucleotides (SSO)-treated cells as compared to scrambled SSO-treated cells. For proliferation assays, growth is shown relative to cells treated with the scrambled non-targeting SSO. The mean and standard deviation of three biological replicates are shown. p-values for growth were determined using Student’s t-test. *p<0.05. A representative splicing gel together with the PSI of the HNRNPM-regulated isoforms are shown below each barplot. As controls, a HNRNPM targeting SSO is also included (lane 2). For each gene (ZNF548, PRKAB2, and EED), multiple SSOs targeting different sequences were used. ZNF548 SSO-1, ZNF548 SSO-2, and PRKAB SSO-1 are control SSOs that do not induce inclusion events. For the EED event, both 2-O-methyl (2OMe) and 2-methoxy-ethyl (MOE)-based SSO backbone chemistries were used to control for potential toxicities due to SSO transfection. SSO backbone chemistries used are indicated at the top of each panel. (D) Disease-free survival plot of The Cancer Genome Atlas (TCGA) prostate adenocarcinoma (PRAD) patients, stratified by the total number of events per patient where the PSI of a given HNRNPM-regulated exon exceeds that of the median PSI within the patient population. Patients with more exon inclusion events (top 75th percentile) are shown in blue, whereas patients with less exon inclusion events (lower 25th percentile) are shown in red. (E) WD40 domain 5 of EED when the HNRNPM-regulated exon 10 is included. Structure of the HNRNPM-regulated WD40 domain in WT EED (gray), superimposed on the predicted structure of the HNRNPM-dependent EED isoform (blue). The new peptide generated by the splicing event is depicted in orange. (F) Closeup view of hydrogen bonding interactions that stabilize the WD40 beta sheet in either WT or the new EED isoform. (G) Western blot of H3K27me3 (EED target), HNRNPM, and EED upon treatment with the scrambled, HNRNPM-targeting SSO (HNRNPM) or SSOs that promote the inclusion of EED exon 10 (EED SSO-1 and SSO-2). Backbone chemistry of the SSOs used is indicated. Untreated cells are included as controls. HNRNPM. Shown also are histone 3 and actin B loading controls. (H) Disease-free survival curves of prostate cancer patients when expression in transcripts per million (TPM) of EED is low (blue) or high (red).

Figure 6.

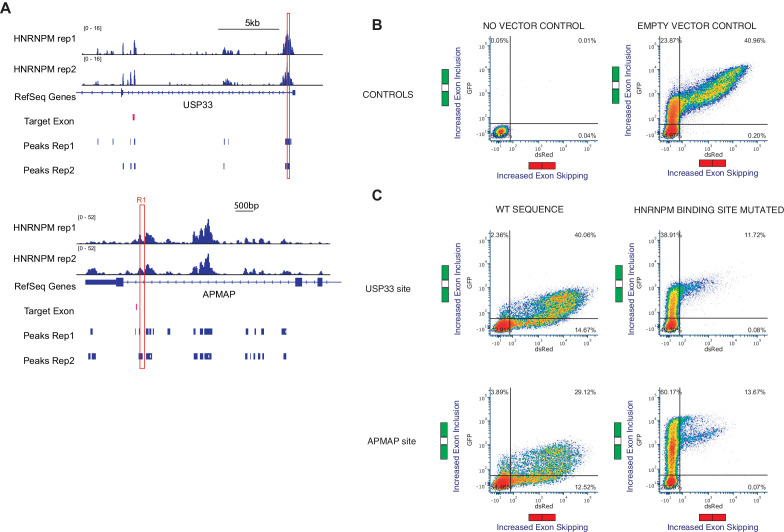
Figure 6—figure supplement 1. HNRNPM-bound sequences inhibit exon inclusion.

Figure 6—figure supplement 1.

(A) Plots showing HNRNPM-bound regions of the USP33 and APMAP gene that were cloned and inserted into the minigene construct. (B) Representative flow cytometry plots showing differential splicing patterns of cells that were transfected with the indicated constructs. Left: no plasmid control; right: unmodified vector control. y-axis shows increasing levels in exon inclusion, and x-axis shows increasing levels of exon skipping. (C) Representative flow cytometry plots showing differential splicing patterns of cells that were transfected with the indicated constructs. Left: vectors with wildtype HNRNPM-binding site; right: vectors with mutated HNRNPM-binding site. y-axis shows increasing levels in exon inclusion, and x-axis shows increasing levels of exon skipping.
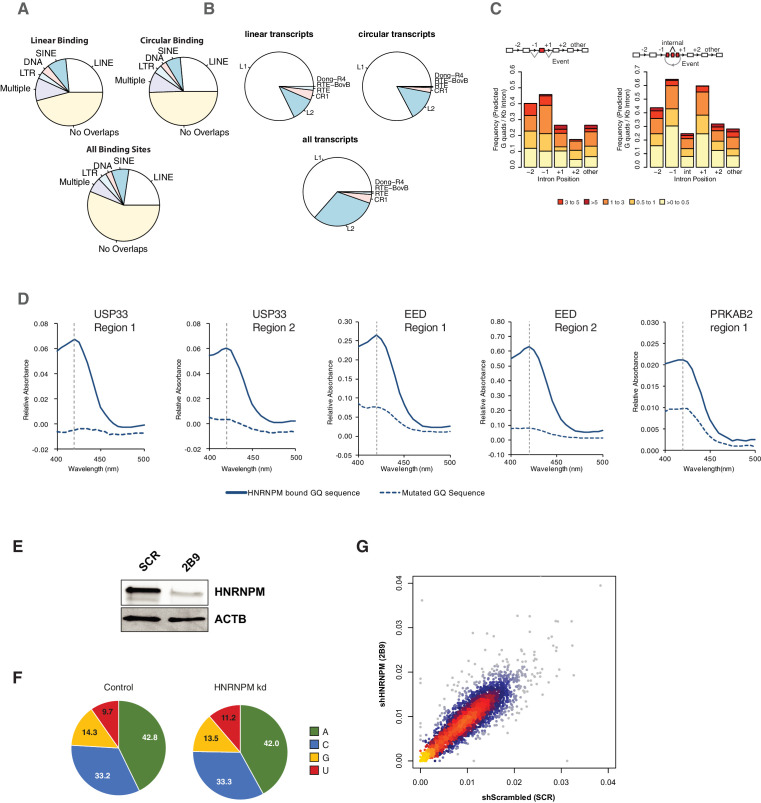
Figure 6—figure supplement 2. Structural characterization of HNRNPM-bound introns.

Figure 6—figure supplement 2.

(A) Distribution of unique HNRNPM peaks found in the immediate flanking upstream and downstream introns of mis-spliced linear (top-left panel) or circular (top-right panel) mis-splicing events that share a >10% overlap with one or multiple classes of four types of repetitive elements (long-interspersed nuclear elements [LINEs], short-interspersed nuclear elements [SINEs], DNA, and long terminal repeat [LTR]). The overlap of these elements with HNRNPM peaks found across the transcriptome is indicated in the bottom panel. (B) Types of LINEs associated with HNRNPM-binding sites at mis-spliced linear (top-left panel) and circular (top-right panel) transcripts compared to that in regions bound by HNRNPM (bottom panel) across all transcripts. (C) Distribution of G-quadruplex-forming regions in the upstream (−1 or −2) or downstream (+1 or +2) introns relative to mis-spliced linear (left) or circular (right) events. Counts are normalized to the length of the intron. (D) Colorimetric, hemin-based assay for RNA G-quadruplex folding. RNA oligos of HNRNPM-binding sites of the USP33, EED, and PRKAB2 genes were folded in the presence of potassium and incubated with hemin. The presence of RNA G-quadruplexes in conjunction with hemin results in a peroxidase activity, which can be detected as an increase in absorbance at 420 nm. As a negative control, the same test oligos with mutated GQ sites were used (dotted lines). (E) HNRNPM protein levels in cells used for targeted DMS-MaPseq. (F) Base mutation frequencies in scrambled shRNA or HNRNPM (2B9) shRNA-treated LNCAP cells. (G) Overall correlation of the structure probing data for scrambled shRNA and HNRNPM shRNA (2B9)-treated cells. Representative HNRNPM-bound sites in the introns flanking mis-splicing events for PRKAB2, USP33, ZNF548, ZNF304, GMPR2, and GAPDH were used for this analysis.
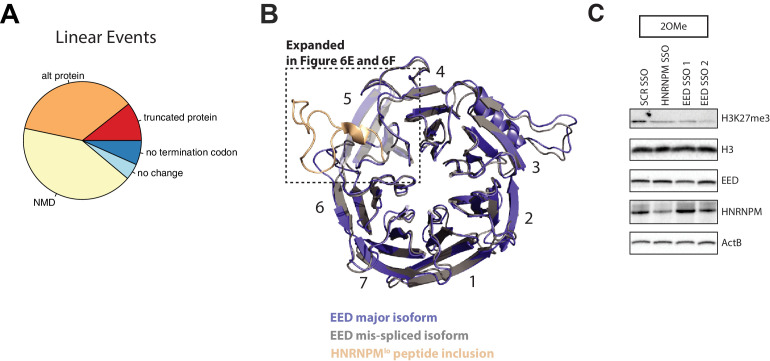
Figure 6—figure supplement 3. HNRNPM regulates a multigenic splicing program to maintain cell proliferation.

Figure 6—figure supplement 3.

(A) Distribution of predicted outcomes of HNRNPM-dependent linear-splicing events occurring in coding domains of affected genes. (B) Structure of the HNRNPM-regulated WD40 domain in wildtype EED protein (gray), superimposed on the predicted structure of the HNRNPM-dependent EED isoform (blue) that contains the 25 aa long peptide coded by the exon regulated by HNRNPM. The new peptide generated by the splicing event is depicted in orange. WD domains in EED are numbered. (C) Independent replicate of western blot shown in Figure 6G. H3K27me3 (EED target), HNRNPM, and EED upon treatment with the scrambled, HNRNPM targeting splice-switching-antisense-oligonucleotides (SSO) (HNRNPM) or SSOs that promote the inclusion of EED exon 10 (EED SSO-1 and SSO-2) is shown. Backbone chemistry of the SSOs used is indicated. Shown also are histone three and actin B loading controls.