
Figure 4.
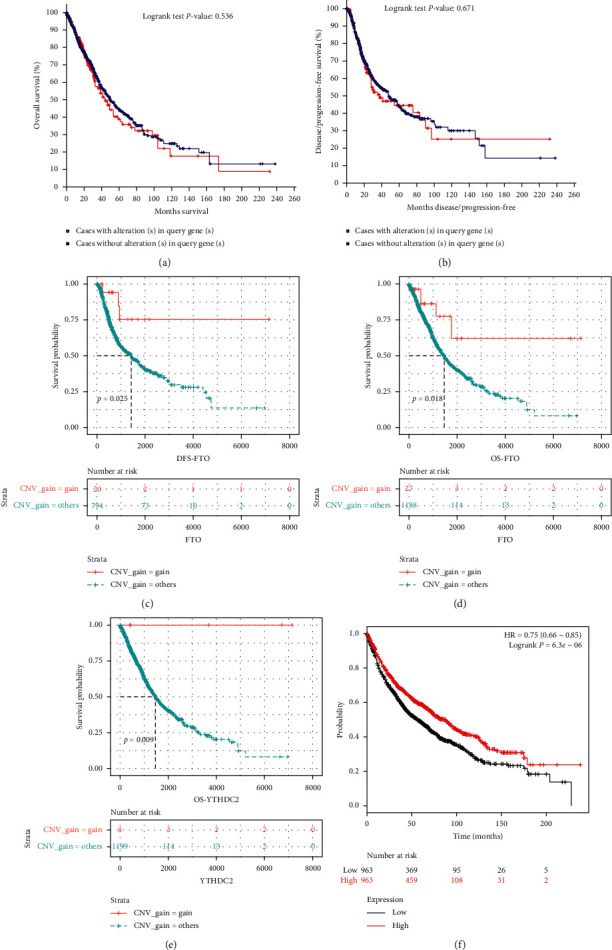
Survival analysis of NSCLC patients with CNVs of m6A-related regulators. ((a)-(b)) OS and DFS for NSCLC patients who have any alteration of m6A-related regulators, ((c)-(d)) DFS and OS for patients with NSCLC who have different CNV types of FTO, (e) OS for patients with NSCLC who have different CNV types of YTHDC2, and (f) OS for patients with FTO mRNA expression levels by Kaplan–Meier plotter.