
Figure 3. Tornado Diagrams for EHCF+LGG Versus EHWF.
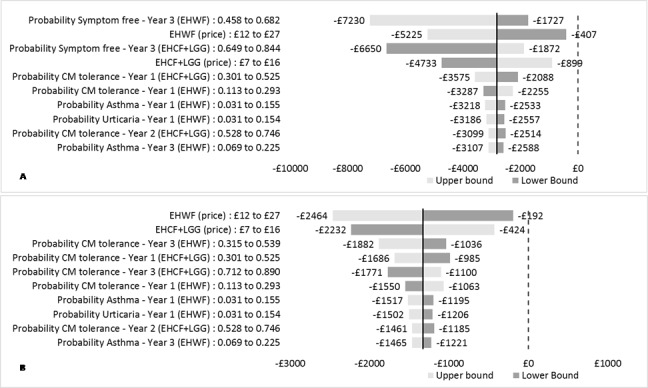
A: Tornado diagram for the probability of being symptom free at 3 years; B: Tornado diagram for the probability of being tolerant to cow’s milk at 3 years.
Abbreviations: CM, cow’s milk; EHCF+LGG, extensively hydrolysed casein formula containing Lactobacillus rhamnosus Gorbach Goldin (EHCF+LGG); EHWF, extensively hydrolysed whey formula.
The tornado diagram represents how varying inputs between specific ranges influences the outcomes. The bold vertical line represents the base case results. The horizontal bars are stacked in order of decreasing width, with more influential inputs at the top. Horizontal lines crossing the vertical dashed line would represent a change in the conclusions of the model caused by varying a single parameter.