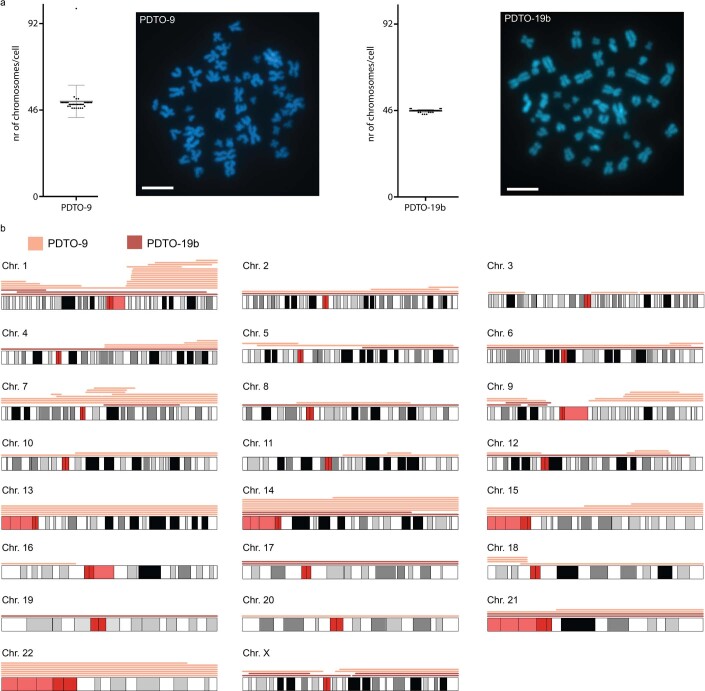
Extended Data Fig. 10. Overview of CNA events per chromosome for PDTO-9 and PDTO-19.
a, Genome-wide map of all de novo CNA events that were observed in eight PDTO-9 and four PDTO-19b datasets (respectively, 310 and 158 analysed single cells), and 64 PDTO-9 cell divisions (128 analysed single cells). Events include reciprocal CNAs, non-reciprocal whole-chromosome gains or losses and non-reciprocal sub-chromosomal CNAs represented in more than one cell. Hopeful monster karyotypes were excluded for this representation. Centromeric and other complex regions of chromosomes are depicted in red. b, Metaphase spread-based karyotyping of 36 tumor cells from PDTO-9 and PDTO-19b stained with DAPI to confirm their near-diploid genome. Each dot represents a tumor cell, center bar and error bars represent the mean and standard deviation. Scalebar is 5 μm.

