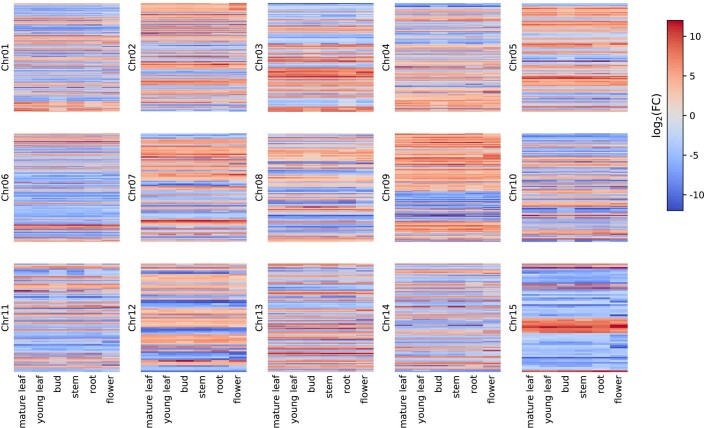
Extended Data Fig. 5. Genes with consistent allele-specific expression (ASE) pattern across six tissues of bud, root, stem, flower, young and mature leaves.
The color bar represents log2(FC) values. FC indicates fold change of FPKM values between allele A and allele B. Red color suggests that expression in allele A is significantly higher than allele B and blue color means that expression in allele B is significantly higher than allele A.

