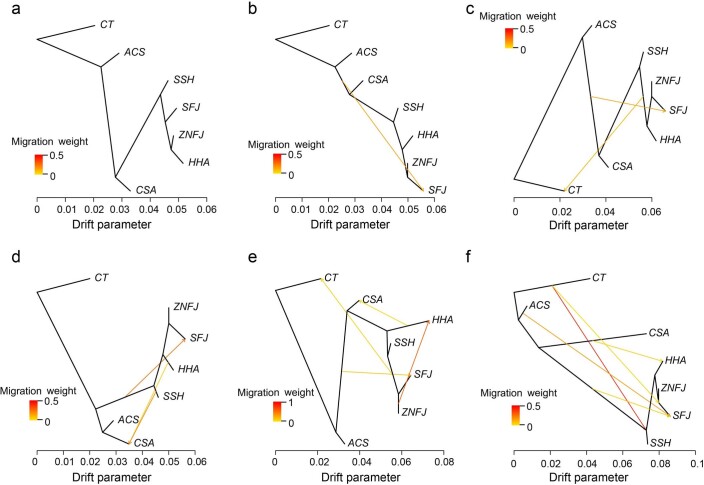
Extended Data Fig. 8. TreeMix analysis of allelic drift among different groups of tea populations.
Best-fitting genealogy for the tea populations calculated from the variance-covariance matrix of genome-wide allele frequencies. The lines with arrows indicates possible migration events. Color scale represent the weight of migration. and the scale bar indicates 10 times the average SE of the relatedness among populations based on the variance–covariance matrix of allele frequencies.

