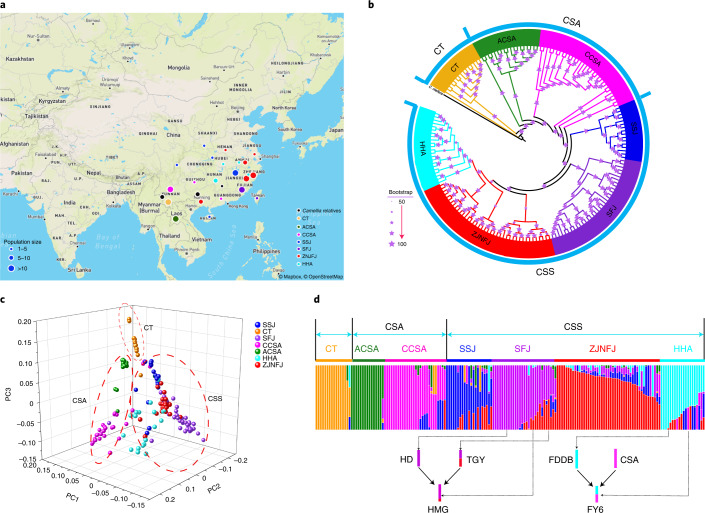
Fig. 2. Phylogenetic relationships and population structure of resequenced individual tea plants.
Accessions are represented in the same color code throughout this figure (black, wild close relatives; orange, CT or C. taliensis; green, ACSA; pink, CCSA; dark blue, SSJ; purple, SFJ; red, ZJNFJ; cyan, HHA). a, Geographic distribution of resequenced individual tea plants. Population sizes are indicated by circle sizes. Base map © OpenStreetMap (https://www.openstreetmap.org/copyright). b, Maximum-likelihood tree with bootstrap values supported. Larger sizes of asterisks indicate higher values of bootstraps, mostly close to 100%. c, PCA of resequenced individual tea plants. PC, principal component. d, Ancestry results from Admixture under the k = 7 model supported by an examination of cross-validation errors (Extended Data Fig. 7). Two documented modern breeding events are indicated below the Admixture plot (HD, Huangdan; HMG, Huangmeigui; FDDB, Fudingdanbai; FY6, Fuyun 6).

