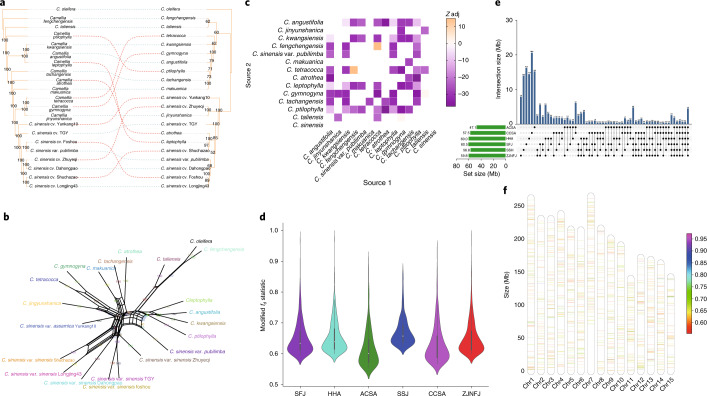
Fig. 3. Genome-wide patterns of genetic introgression to modern tea cultivars from their close relatives.
a, Cytonuclear conflicts between nuclear and chloroplast phylogenetic trees among 14 resequenced Camellia section Thea species with C. oleifera included as the outgroup. b, SplitsTree network for Camellia accessions from section Thea. c, Detection of introgression events between C. sinensis and close relatives using the f3 test. Z scores were adjusted based on a Benjamini–Hochberg false discovery-rate correction method, and significant introgression is indicated with purple if adjusted (adj) Z score < −1.96. d, Distribution of 95th percentile fd outliers using modified fd statistics (y axis) in six groups of cultivated tea populations (x axis). The white dot in the center of each violin plot represents the median value, and the bounds of each box indicate first (25%) and third (75%) quartiles. Minima and maxima are present in the lower and upper bounds of the whiskers, respectively, and the width of whiskers are densities of modified fd statistics. P values were calculated using two-sided Fisher’s exact test without multiple comparisons. e, Amount of unique and shared introgressed sequences (in Mb) among six groups of cultivated tea populations. f, Distribution of introgressed loci along chromosomes (chr) 1–15, with the colored bar indicating the maximum of modified fd statistics in each 100-kb non-overlapping window.

