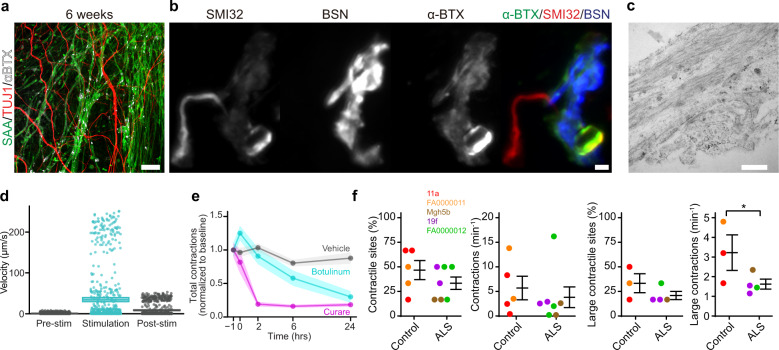
Fig. 5. Sensorimotor organoids form functional NMJs, which are impaired in ALS cultures.
a TUJ1+ neurons juxtaposed with SAA+ and α-bungarotoxin (αBTX)+ skeletal muscle at 6 weeks in culture. Scale bar, 100 µm. b NMJs at high magnification depicting SMI32+ neuronal terminals and presynaptic BSN staining that abuts postsynaptic αBTX staining. Scale bar, 2 µm. c Electron micrograph of an NMJ showing synaptic densities that separate presynaptic vesicles (bottom right) from longitudinally cut muscle fibers (top) at 9 weeks in culture. Scale bar, 500 nm. d Quantification of muscle contraction triggered by optogenetic activation of neurons. Neurons expressing hSYN::ChR2 evoke the rapid movement of muscle fibers when stimulated with blue light. e Pharmacology of muscle contractions in sensorimotor organoids. Spontaneous muscle contractions in 8-week-old cultures are inhibited by curare and botulinum toxin, the latter indicating dependence on synaptic function. Inhibition of contractions by each drug was assessed in five independent biological differentiation replicates of four iPSC lines (11a, MGH5b, 19f, and FA0000012). Plots show mean and 95% confidence intervals as line and shaded area, respectively. f Unbiased analysis of contraction site and frequency. Skeletal muscle contractions at six sites per organoid culture were counted and pooled from three independent biological differentiation replicates of five iPSC lines at 7–8 weeks. Percentage of contractile sites and contraction frequency per organoid culture were quantified separately for all contractions (left two panels, n = 5 control, and 7 ALS organoids; contractile sites: two-sided ANOVA type 3, F = 1.458, P = 0.255; all contractions: two-sided ANOVA type 3, F = 0.343, P = 0.571), and large contractions (right two panels, n = 3 control, and 4 ALS organoid cultures, large contractile sites: two-sided ANOVA type 3, F = 1.7532, P = 0.243; large contractions: two-sided ANOVA type 3, F = 8.289, P = 0.035). iPSC lines: 11a (red), FA0000011 (orange), MGH5b (brown), 19f (purple), and FA000012 (green). Bars indicate mean and SEM.

