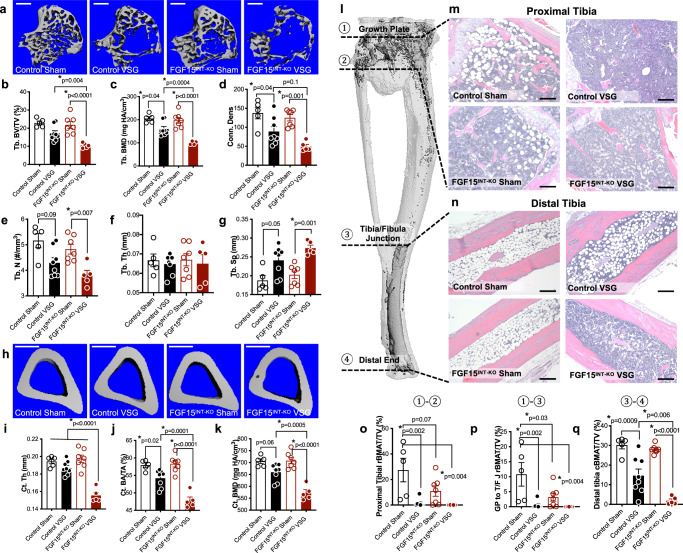
Fig. 2. Intestinal-derived FGF15 partially preserves bone and bone marrow adipose tissue (BMAT) loss following VSG.
a 3D images of trabecular bone, scale bars 500 μm. b Trabecular bone volume fraction (Tb. BV/TV), c trabecular bone mineral density (Tb. BMD), d trabecular bone connective density (Conn. Des) and e trabecular number (Tb. N), f thickness of the trabecular bone (Tb. Th), g spacing between trabeculae (Tb. Sp). h 3D images of mid-cortical bone, scale bars 500 μm. i Thickness of the cortical bone (Ct. Th). j Cortical bone area (Ct. BA/TA) and k cortical bone mineral density (Ct. BMD). l Tibial BMAT was visualized by osmium staining. m, n Representative sections from proximal and distal tibiae were stained with H&E and are shown at ×100 magnification, scale bars 200 μm. l Tibial BMAT was quantified relative to total bone volume after osmium staining within the indicated regions as shown in (o) proximal Tibia (①-②), p growth plate (G/P) to tibia/fibula junction (T/F J) (①-③), q distal tibia is T/F J to distal end (③-④). Animal number: Control Sham (n = 5), Control VSG (n = 8), FGF15INT-KO Sham (n = 7), FGF15INT-KO VSG (n = 5). Data are shown as means ± SEM. *p < 0.05 (two-way ANOVA with Tukey’s post hoc test).

