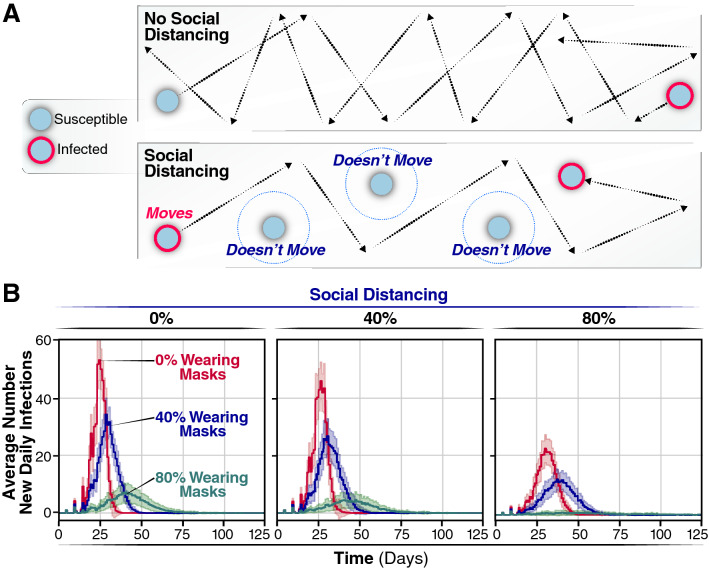
Figure 2.
Average new infections per day when varying the population wearing masks and practicing social distancing. (A) SD is implemented by assigning agents to not move along a trajectory during the simulation. This lack of movement reduces the number of trajectories overlaps between agents and subsequently reduces the number of transmission events. (B) The number of new infections per day for 0, 40, or 80% of a population wearing face-masks are displayed by red, blue, or green trajectories, respectively, for 0% of the population practicing SD, for the 40% and for the 80%. Simulations were repeated 100 times for each condition, the curves and the highlighted regions around the curves represent the mean value + /- one standard deviation.

