
Fig. 3. Genome-wide allele frequency patterns.
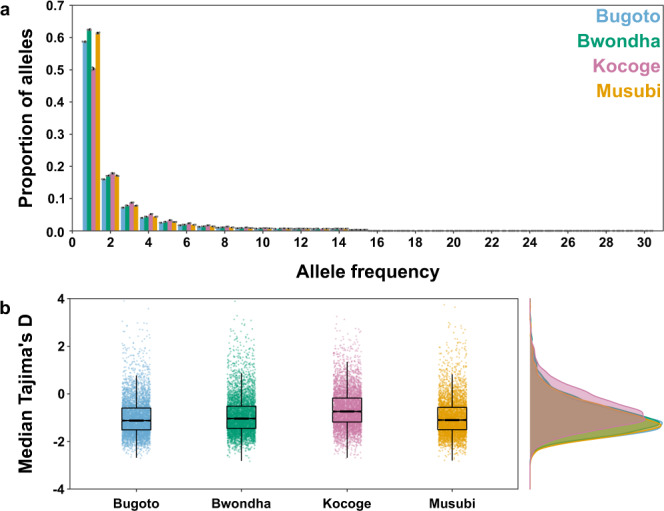
a One-dimensional site frequency spectra for each parasite population sampled from children in each school: Bugoto (light blue), Bwondha (green), Musubi (yellow) and Kocoge (pink). For each school, miracidial populations were subsampled (n = 15 miracidia per school) and site frequency spectra were calculated, this was repeated for a total of five replicates. The x-axis represents the derived allele frequency and y-axis represents the proportion of sites at each allele frequency. Coloured bars represent the median proportion of sites across all replicates for each school, black error bars represent the standard deviation around the median for all replicates, grey points represent the individual results for each replicate. b Median Tajima’s D values calculated in 5 kb windows across each autosome for each school population. For all boxplots, the central line indicates the median, the top and bottom edges of the box indicate the 25th and 75th percentiles, respectively. The maximum whisker lengths are specified as 1.5 times the interquartile range.