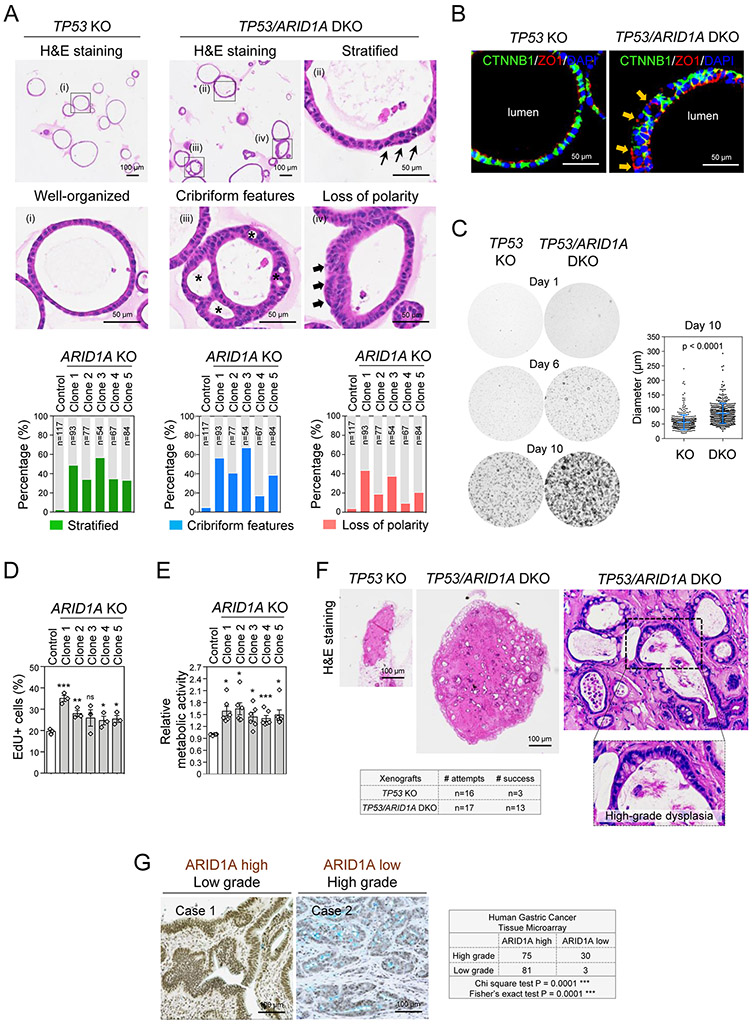
Figure 2. CRISPR KO of ARID1A promotes gastric malignancy.
A, TP53 KO (control) organoids were typically well-organized morphologically; however, TP53/ARID1A DKO organoids exhibited different degrees of architectural complexity. H&E staining. Quantitation revealed increased epithelial stratification (green bar), structural complexity (blue bar), and loss of polarity (red bar) in all five TP53/ARID1A DKO clones. B, Immunofluorescence staining of the apical-specific marker ZO1 (red) showed disruptions in apicobasal polarity in a subset of TP53/ARID1A DKO organoid cells. The arrow (orange) indicates loss of polarity with inappropriate basolateral ZO1 expression. Cell membrane was stained with CTNNB1 (green). Nuclei were stained with DAPI (blue). C, ARID1A-deficient organoids exhibit hyperproliferation. TP53 KO and TP53/ARID1A DKO organoids were grown from 20,000 single FACS-sorted BFP+ cells. Brightfield images were taken after cell sorting. Quantification of organoid size is shown (n=400 per group). D, Quantification of EdU-positive proliferating cells in TP53 KO and TP53/ARID1A DKO organoids from independent experiments (N=3) at day 6 after passage. E, Quantification of metabolic activity from independent experiments (N=6) was determined by Alamar blue assay at day 12 after passage. Relative metabolic activity was normalized to TP53 KO organoids (Control). Dots indicate independent experiments. The horizontal bar indicates mean. The error bar represents SEM. *P<0.05, ***P<0.005. ns, not significant. F, ARID1A-deficient organoids exhibited efficient in vivo tumor formation upon subcutaneous xenografting into NSG mice. TP53/ARID1A DKO xenografts formed larger tumors compare with TP53 KO xenografts. H&E staining. G, A significant negative correlation between ARID1A expression and tumor grade was identified in a human gastric cancer tissue microarray (total 197 patients). ARID1A expression was assessed by IHC.

