

Graphical abstract

Keywords: Cyclin protein, Classification, Feature extraction, Feature selection, Random forest
Highlights
-
•
An computational method was developed to identify Cyclin Protein.
-
•
Several kinds of features were proposed to formulate protein samples.
-
•
A fusion feature set could produce a high accuracy.
Abstract
Cyclin proteins are capable to regulate the cell cycle by forming a complex with cyclin-dependent kinases to activate cell cycle. Correct recognition of cyclin proteins could provide key clues for studying their functions. However, their sequences share low similarity, which results in poor prediction for sequence similarity-based methods. Thus, it is urgent to construct a machine learning model to identify cyclin proteins. This study aimed to develop a computational model to discriminate cyclin proteins from non-cyclin proteins. In our model, protein sequences were encoded by seven kinds of features that are amino acid composition, composition of k-spaced amino acid pairs, tri peptide composition, pseudo amino acid composition, geary correlation, normalized moreau-broto autocorrelation and composition/transition/distribution. Afterward, these features were optimized by using analysis of variance (ANOVA) and minimum redundancy maximum relevance (mRMR) with incremental feature selection (IFS) technique. A gradient boost decision tree (GBDT) classifier was trained on the optimal features. Five-fold cross-validated results showed that our model would identify cyclins with an accuracy of 93.06% and AUC value of 0.971, which are higher than the two recent studies on the same data.
1. Introduction
Cyclin belongs to a group of proteins which are capable to control the cell cycle by triggering Cdk [1]. Cyclin concentration changes on different levels at several stages of the cell cycle. These changes occurred due to the ubiquitin-mediated cyclin degradation [2]. Cyclin combines with cyclin dependent kinases, like cdk1 proteins and p34, to trigger the cyclin dependent kinase active sites. This cdk1, p34 and cyclin combination forms a MPF (maturation-promoting factor) which activates other proteins [3]. However, phosphorylation is needed for the complete activation of cyclin dependent kinase active sites [3]. Therefore, these phosphorylated proteins are liable for the specific movements during the division of cell cycle e.g., chromatin remodeling and the formation of microtubules [3], [4].
After the Human Genome Project (HGP), biological sequence data has progressively shattered [5]. The traditional investigational techniques have not only low efficient and expensive but also are time consuming. Therefore, it is urgent to identify sequences efficiently in a short period of time. However, existing tools such as FASTA [6] and BLAST [7] only compare the sequence with the known protein databases [8], [9], these tools cannot discriminate whether it is a cyclin or non-cyclin. Now, machine learning classifications are popular in this area [10], [11], [12], [13]. In prior methods, StAR [14] and other classifiers using Pseudo-amino acid composition (PseAAC) could identify cyclins with an accuracy of 83.53%. Sun et al. [15] established a cyclin prediction model based on support vector machine (SVM) which could produce an accuracy of 91.90%. Although both cyclin prediction model can produce good outcomes, there is still room for further improvement by extracting more feature information.
To address the aforementioned issues, an ensemble model was established to predict cyclin in multiple eukaryotic genomes. Fig. 1 shows the workflow of the proposed model. First, seven types of feature descriptors, Amino acid composition [16], Tri-peptide composition [17], Composition of K-spaced amino acid composition [18], [19], Geary autocorrelation [20], Normalized moreau-broto autocorrelation [21], C/T/D [22] and PseAAC [23], [24] were used as features to input into a GBDT classifier [25]. After this, ANOVA [26] and the mRMR [27] with IFS [28] technique was utilized to get optimal feature vectors. The outcomes were evaluated by using five-fold cross validation.
Fig. 1.

The flowchart of the whole study.
2. Materials and methods
A reliable and accurate dataset is necessary to establish a prediction model [29], [30], [31], [32], [33], [34], [35]. Therefore, the dataset was obtained from Mohabatkar et al. [14]. They collected 215 cyclins and 204 non-cyclin proteins to train and test the methods for cyclins prediction. To reduce the overfitting derived from high similarity of sequences, we applied a cluster database at high identity with tolerance 90% [36] and discarded the sequences that exhibited more than 90% sequence identity. As a result, we attained the 167 cyclin and 167 non-cyclin proteins. Then we divided into 70/30 ratio in order to training and testing the model.
2.1. Feature descriptors
Selecting the feature-encodings that are instructive and autonomous is an important step in creating machine learning models [37], [38], [39], [40]. Expressing the protein sequences with a mathematical formulation is key and difficult in functional element identification [41], [42], [43], [44]. Therefore, seven types of feature-encoding approaches were presented to describe the protein sequences.
2.1.1. Amino acid composition descriptor (AAC)
AAC calculates the frequency of single type of amino acids in a protein sequence [16], [45], [46], [47], [48], [49], [50]. The frequencies of 20 residues can be calculated as
| (1) |
where is the number of the p-th residue in a protein sequence with the length of N residues.
2.1.2. Composition of k-spaced amino acid pairs descriptor (CKSAAP)
The encoding technique composition of k-spaced nucleic acid pairs embodies the incidence of nucleotide pairs disconnected by any K nucleotide (K = 0, 1, 2, 3, 4, 5). The CKSAAP [18], [45], [51] is defined as k-spaced residue pairs which is illustrated as
(2)where is the number of residue pairs and k denotes the number of nucleotides. In this study, k = 3 and the dimension of the composition of k-spaced amino acid pairs feature was 1600.
2.1.3. Pseudo amino acid composition descriptor (PseAAC)
PseAAC describes the occurrence of the amino acid frequency and the correlation of between two residues’ physicochemical properties [23]. It consists of and .
| (3) |
| (4) |
where is the number of properties and is the i-th amino acid occurrence. is the ith amino acid property value and is the sequence order factor.
2.1.4. Tri-peptide composition descriptor (TPC)
TPC are three amino acid molecules joined together and reflects hypothetically substantial starting points for the design of small biotic modulators [17]. Tripeptide composition is defined as
| (5) |
where represents the number of tripeptide amino acid type l, m, n.
2.1.5. Composition\transition\distribution descriptor (C/T/D)
C/T/D defines the global composition of an amino acid sequence and the frequencies of two different adjoining amino acids and the distribution pattern of an amino acid sequence. Sequence scrambling is the first job to compute the composition, transition and distribution [52]. On the basis of their attributes, amino acids are alienated into three classes (class 1, class 2 and class 3) [24], also named reduced or simplified amino acids [53], [54]. Classifications of charge and hydrophobicity are shown in Table 1. C/T/D with composition , transition and distribution is defined as .
| (6) |
| (7) |
| (8) |
where is the class number, is the adjoining number of class b and c. is the number of those AA which are in z-th of b-th class.
Table 1.
Attribute classification.
| C 1 | C 2 | C 3 | Attributes |
|---|---|---|---|
|
±tive R, K |
Not + tive nor -tive A, N, C, Q, H, I, G, L, F, P, S, M, W, Y, V, T |
-tive D, E |
Charge |
|
Polar D, E, K, N, Q, R |
Not + tive nor -tive A, G, H, P, S, T, Y |
Hydrophobic C, F, I M, V, W |
Hydrophobicity |
2.1.6. Geary descriptor (GD)
Geary descriptor is a kind of correlation descriptor and have a maximum similarity with Moran descriptor [55]. It is well-defined as :
| (9) |
where is the property value of the i-th amino acids in AA index.
2.1.7. Normalized moreau-broto autocorrelation descriptor (NMBroto)
NMBroto is also a type of autocorrelation [21] and also have a likeness with Moran as shown in below equation.
| (10) |
where is the property value of the i-th amino acids in AA index.
2.2. Feature selection
The noise in feature vector might result in the unsatisfactory performance of a model [56], [57], [58], [59], [60], [61], [62], [63]. Therefore, the selection of features is an obligatory phase to remove the less important features and increase the productivity of a model [37], [64], [65], [66], [67], [68], [69]. Many feature selection and ranking techniques are available, such as ANOVA, F-score [70], mRMR [27], Chi-square [71], LGBM [72], [73]. A high feature dimensions both can create overfitting and information redundancy and produce poor accuracy of the cross -validation prediction. Therefore, ANOVA is good option to tackle these issues because it consumes less time and gave efficient results. The combination of some of the top-executing features does not mean that the top predictive results can be attained. These features are probably to have a high degree of correlation, which leads to additional redundant information in the feature vectors. Therefore, mRMR is a good option to tackle these issues due to less time consuming and efficient results. These techniques are also used in many high dimensional protein features selection. In this study, the ANOVA and mRMR [27] with IFS [56] was applied to obtain the optimal feature subset. The comparison with other state of the art feature selection techniques is given in Fig. 2S in Supplementary file 1.
2.2.1. ANOVA
ANOVA is used for significance test of mean difference between two or more samples. F-value is the ratio of variance between groups and variance within groups [74]. If the F-value will be larger, then the ability of distinguishing positive and negative samples will be better. Therefore, all features can be sorted according to this F-value.
| (11) |
| (12) |
| (13) |
2.2.2. mRMR with IFS
mRMR is a filter-based selection technique [75] to achieve an optimal model. Compactness functions are described as y and z, and P(y) and P(z) are the two corresponding probabilities. P (y, z) is the possibility of compactness, and the common information between the two functions can be defined as
| (14) |
In shared information, searching a subset S with m optimum features helps to determine the feature transmission, which majorly depends on the target {yi} class q.
| (15) |
Minimum redundancy can be defined as
| (16) |
Final selection criteria can be articulated as
| (17) |
The principle of the mRMR technique is to use a typical redundancy and relevance to rank features to acquire the best subset. The IFS [28], [76] scheme was applied in the present study to select the best feature. The details about the IFS method can be found in [56].
2.3. Machine learning classifiers
Classification is a type of supervised learning and have an important role in the decision making [77], [78], [79], [80], [81], [82], [83], [84], [85]. In this study, we select GBDT [25] to identifying cyclin and non-cyclin proteins. Another four kinds of machine learning classifiers Naïve Bayes [86], Support Vector Machine [56], [57], [87], and Ada Boost [88] and Random Forest [84] were performed for comparison.
Gradient boost decision tree algorithm is a very important learning algorithm and has been applied by the researchers in many bioinformatics and mathematical and biological applications [89], [90]. It constructs a climbable and authentic model from a non-linear joint of different weak learners. The main idea of the gradient boost decision tree is to establish a base learner which is excellently interrelated with the loss function of negative gradient [25]. Suppose that there are n numbers of samples:
{()…()} ()
| (18) |
where is the new decision tree (k = 1,2,3….), and is the risk minimization parameter of the new decision tree which is shown in below equation.
| (19) |
Gradient boost decision tree algorithm calculates the final assessment in a forwarding mode.
(20)
Finally, Loss function of negative gradient is used for residual calculation.
| (21) |
At the end, we trained the model by all to calculates the risk minimization parameter. This type of decision trees logically models the relations amongst predictor variables. e.g., mapping the parameters input space X in to J split sections , and the output is for region .
| (22) |
The pseudo code of gradient boost decision tree is given below in Algo 1.
| Algo 1: Gradient Boosting Decision Tree Algorithm |
|---|
| Input: Training Data: = |
| Where, is a data point and is the label for |
| Loss function: = L (, f ()) |
|
| Output: The decision tree function f (x) |
Scikit - learn package (v – 0.22.1) [91] was used to execute the random forest classifiers. Firstly, we used randomized search cross-validation and then grid search cross-validation to tune hyperparameter. The best tuned parameters of the proposed model are given in Table 2.
Table 2.
Best parameters of the proposed model.
| Best Parameters | |
|---|---|
| ‘Max-depth’ | 20 |
| ‘Max-features’ | 05 |
| ‘Min-samples-leaf’ | 03 |
| ‘Learning-rate’ | 0.05 |
| ‘Min-samples-split’ | 02 |
| ‘N-estimators’ | 80 |
| ‘Mean square error’ | 0.1287 |
2.4. Evaluation metrics
Sensitivity (Sn), specificity (Sp), accuracy (Acc), and matthews correlation coefficient (MCC) [92], [93], [94], [95], [96], [97], [98], [99], [100], [101], [102], [103], [104], [105], [106] were used in this study to check the overall efficiency of the model defined as Equation (23).
| (23) |
where TP represents the overall cyclins sequences in benchmark data and FP signifies the cyclins sequences false-classified as non-cyclins. Likewise, TN represents the overall non-cyclins sequences in the data and FN signifies the non-cyclin sequences, which were false-classified as cyclins. Consequently, the receiver operating characteristic (ROC) curve was used to illustrate the efficiency of the model graphically. The ROC curvature could assess the projecting ability of the proposed model on the whole assortment of resultant values. The area under the curve (AUC) was premeditated to check the efficiency of the model. A good classifier gave AUC = 1, and the arbitrary performance gave AUC = 0.5.
3. Results and discussion
3.1. Performance evaluation
First, the training data were converted into feature vectors using feature descriptors (amino acid composition, composition of k-spaced amino acid pairs, tri peptide composition, pseudo amino acid composition, geary correlation, normalized moreau-broto autocorrelation and composition/transition/distribution), and the feature vectors of each encoding model were evaluated by gradient boost decision tree algorithm using a five-fold CV test. Firstly, the ANOVA and mRMR with IFS were used to pick the best feature subset for the sake of better prediction accuracy. Fig. 2(A) and (B) shows the incremental feature selection curve of optimal features and comparison of single encodings and fusion on different machine learning classifiers on the basis of AUC. Table 3 shows the efficiency of the optimized single-encoding models and the feature fusion model on different machine learning methods. The performance of single-encoding models and the fusion model on different machine learning classifiers before feature selection is recorded in Table 1S in Supplementary file 1. We also visualized the single-encoding features and fusion features using t-SNE (t- distributed Stochastic Neighbor Embedding) method before and after feature selection. The t-SNE visualization of single-encoding and fusion before feature selection is available in Fig. 1S in Supplementary file 1 and the t-SNE visualization of the optimized single-encodings and the fusion is shown in Fig. 3. The AUCs of single-encoding models are 0.827, 0.526, 0.825, 0.506, 0.896, 0.854, and 0.890, respectively for AAC, CKSAAP, PseAAC, TPC, C/T/D, GD, and NMBroto. The AUC of composition/transition/distribution was around 0.6% – 39% higher as compared with those of the other encodings. On the contrary, the Acc, Sp, Sn, MCC, and AUC of the feature fusion model were 93.06%, 94.00%, 92.00%, 0.862% and 0.971, respectively. The Acc, Sp, Sn, MCC, and AUC on independent data were 89.36%, 90.10%, 89.45% and 0.823%. ROC with the AUC of 0.954 is given in Fig. 3S in Supplementary file 1. In order to check the better performance and reliability of our model, we further randomly extracted 50 non-cyclin sequences from the public databases and checked the performance by running our model. We found quite reasonable results. The Accuracy, specificity, sensitivity and matthews correlation coefficient were 90.09%, 91.11%, 89.45%, and 0.829%.
Fig. 2.

Plot showing the Incremental Feature Selection (IFS) procedure for identifying Cyclins in 5-fold cross-validation. (A) Firstly, 5711 features were selected from a total of 10,200 features by ANOVA. (B) 304 optimal features were further obtained from the 5711 features by using mRMR. The Acc increases from 88.92% to 93.06%. (C) Feature descriptor contribution in GBDT-based fusion model to predict cyclins. (D) Comparison between single-encodings and fusion features on different machine learning classifiers.
Table 3.
Performance of optimized single-encodings and fusion models on different machine learning classifiers.
|
GBDT SVM NB AB RF |
|||||||||||||||||||||||||
|---|---|---|---|---|---|---|---|---|---|---|---|---|---|---|---|---|---|---|---|---|---|---|---|---|---|
| Descriptor | Acc | Sp | Sn | MCC | AUC | Acc | Sp | Sn | MCC | AUC | Acc | Sp | Sn | MCC | AUC | Acc | Sp | Sn | MCC | AUC | Acc | Sp | Sn | MCC | AUC |
| AAC | 76.34 | 74.70 | 79.60 | 0.520 | 0.827 | 55.39 | 55.20 | 57.50 | 0.108 | 0.551 | 74.55 | 77.00 | 70.10 | 0.493 | 0.800 | 76.35 | 74.70 | 79.60 | 0.528 | 0.811 | 76.05 | 74.65 | 77.68 | 0.518 | 0.824 |
| CKSAAP | 51.19 | 52.00 | 79.60 | 0.029 | 0.526 | 50.29 | 50.20 | 60.50 | 0.006 | 0.503 | 52.09 | 54.00 | 24.20 | 0.051 | 0.523 | 50.09 | 50.00 | 80.20 | 0.001 | 0.505 | 53.22 | 53.12 | 79.88 | 0.032 | 0.551 |
| C/T/D | 82.33 | 81.40 | 83.80 | 0.647 | 0.896 | 58.68 | 55.00 | 91.00 | 0.231 | 0.587 | 72.45 | 68.00 | 83.80 | 0.461 | 0.808 | 75.44 | 73.50 | 79.50 | 0.511 | 0.820 | 82.16 | 81.10 | 83.24 | 0.644 | 0.892 |
| Geary | 78.74 | 77.30 | 81.40 | 0.576 | 0.854 | 50.39 | 52.70 | 47.30 | 0.048 | 0.524 | 74.55 | 75.90 | 71.90 | 0.492 | 0.816 | 69.76 | 70.10 | 68.90 | 0.395 | 0.762 | 79.71 | 78.10 | 81.77 | 0.582 | 0.876 |
| NMBroto | 81.13 | 80.60 | 82.00 | 0.623 | 0.890 | 79.04 | 80.50 | 76.60 | 0.582 | 0.790 | 79.94 | 81.60 | 77.20 | 0.600 | 0.877 | 68.26 | 67.00 | 71.90 | 0.366 | 0.765 | 80.93 | 79.83 | 82.00 | 0.621 | 0.890 |
| PAAC | 76.04 | 74.90 | 78.40 | 0.522 | 0.825 | 70.65 | 67.50 | 79.60 | 0.420 | 0.707 | 62.87 | 58.60 | 88.00 | 0.298 | 0.745 | 69.16 | 67.00 | 75.40 | 0.386 | 0.754 | 75.88 | 74.40 | 78.32 | 0.521 | 0.825 |
| TPC | 50.89 | 80.00 | 24.00 | 0.074 | 0.506 | 49.40 | 49.50 | 59.30 | −0.01 | 0.492 | 50.59 | 51.40 | 21.60 | 0.015 | 0.502 | 49.40 | 49.30 | 39.50 | −0.01 | 0.493 | 50.28 | 78.90 | 24.00 | 0.071 | 0.498 |
| Fusion All | 93.06 | 94.00 | 92.00 | 0.862 | 0.971 | 79.34 | 78.40 | 80.91 | 0.574 | 0.794 | 87.00 | 88.90 | 84.70 | 0.752 | 0.936 | 82.33 | 76.30 | 87.50 | 0.628 | 0.888 | 91.08 | 92.55 | 91.11 | 0.837 | 0.956 |
Fig. 3.

t-SNE visualization of optimized single encoding features and fusion feature. From (A) to (G) showing single encodings and (H) showing fusion of the single encodings. In the figure, 0 in blue color represents non-cyclin and 1 in orange color showing cyclins. (For interpretation of the references to color in this figure legend, the reader is referred to the web version of this article.)
3.2. Performance evaluation of different ML algorithms
Single-encoding AAC, CKSAAP, PseAAC, TPC, C/T/D, GD, NMBroto and feature fusion models were inputted into different machine learning classifiers such as Ada boost, SVM, and Naive bayes algorithm. Their performances were compared with that of gradient boost decision tree classifier-based models. A five-fold cross-validation test was used to evaluate these model performances. Results were shown in Table 3. We may notice that the accuracies of feature fusion models were always higher than those of single-encoding models, indicating that the multiple information was effective to achieve better results. Fig. 2 (C) showed the feature descriptor contribution in GBDT-based fusion model. The optimized fusion model consists of 304 features of seven descriptors. AAC descriptor contributed 3.28 % in final fusion model because their 10 features were participated in the fusion model. CKSAAP descriptor contributed 16.11 % in final model because their 49 features were participated in the fusion model. CTD descriptor contributed 13.15 % in final model because their 40 features were in the final fusion model. Geary descriptor contributed 32.89 % because their 100 features were participated in the fusion model. NMBroto descriptor contributed 26.31 % in the final optimized model due to their 80 best features. PAAC contributed 4.93 % in the model with their 15 features and TPC contributed 3.28 % in the final optimized model with their best 10 features. Fig. 2 (D) exhibited that the GBDT-based fusion model performed best among all methods. Particularly, the AUC of GBDT classifier was almost 3.5% – 17.7% higher than that of the other models, indicating that the GBDT-based model was the best for cyclin identification.
3.3. Comparison with existing models
In recent studies, Mohabatkar et al., [14] and Sun et al., [15] used the similar dataset for training their models by using jackknife cross-validation. The accuracies of their models were 83.53% and 91.90%, respectively. We also used the same dataset and applied GBDT algorithm. Results on jackknife cross-validation and five-fold cross-validation showed that our model is better than the two existing models. The comparison of two existing models with our model has been shown in Table 4 and Fig. 4.
Table 4.
Comparison between proposed model and existing methods.
Fig. 4.
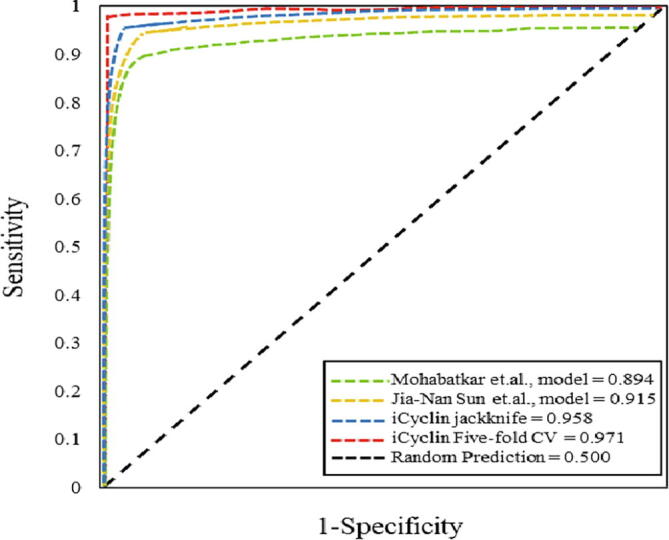
ROC curve of proposed model and the two existing methods on the basis of jackknife and five-fold cross-validation. The AUCs of different models have been showed.
4. Conclusions
Cyclin proteins are capable to regulate the cell cycle and forms a complex with cyclin-dependent kinases. This complex activates cell cycle but the full activation requires phosphorylation. Cyclin protein have low similarity between their sequences. To date, numerous predictors have been established to classify cyclins in diverse species [14], [15], [107]. In this study, an advanced ensemble model was established to identify cyclins. In the proposed model, protein sequences were encoded by using AAC, CKSAAP, PseAAC, TPC, C/T/D, GD, and NMBroto. Then, these encoding-features were optimized by using ANOVA and mRMR with IFS technique. On the basis of top feature subset, the finest sorting model was achieved by the gradient boost decision tree classifier using five-fold CV test. The estimated outcomes on training data showed that the proposed model provided outstanding generalization capability. The data and codes are also available in the Supplementary file 2. Further studies will aim to create a user-friendly web server for the projected model. Also, additional feature selection methods and algorithms will be implemented to further improve the efficiency to classify cyclins [108], [109], [110], [111], [112], [113], [114], [115], [116], [117].
Declaration of Competing Interest
The authors declare that they have no known competing financial interests or personal relationships that could have appeared to influence the work reported in this paper.
Acknowledgments
This work has been supported by the National Natural Science Foundation of China (61772119), Sichuan Provincial Science Fund for Distinguished Young Scholars (2020JDJQ0012).
Footnotes
Supplementary data to this article can be found online at https://doi.org/10.1016/j.csbj.2021.07.013.
Contributor Information
Xiao-Long Yu, Email: yuxiaolong@hainanu.edu.cn.
Hao Lin, Email: hlin@uestc.edu.cn.
Appendix A. Supplementary data
The following are the Supplementary data to this article:
References
- 1.Galderisi U., Jori F.P., Giordano A. Cell cycle regulation and neural differentiation. Oncogene. 2003;22(33):5208–5219. doi: 10.1038/sj.onc.1206558. [DOI] [PubMed] [Google Scholar]
- 2.Morgan DO, The cell cycle: principles of control. 2007: New science press.
- 3.Ferby I., Blazquez M., Palmer A., Eritja R., Nebreda A.R. A novel p34cdc2-binding and activating protein that is necessary and sufficient to trigger G2/M progression in Xenopus oocytes. Genes Dev. 1999;13(16):2177–2189. doi: 10.1101/gad.13.16.2177. [DOI] [PMC free article] [PubMed] [Google Scholar]
- 4.Robinson D.R., Gull K. Basal body movements as a mechanism for mitochondrial genome segregation in the trypanosome cell cycle. Nature. 1991;352(6337):731–733. doi: 10.1038/352731a0. [DOI] [PubMed] [Google Scholar]
- 5.Lee TF, The Human Genome Project: Cracking the genetic code of life. 2013: Springer.
- 6.Pearson WR, Finding protein and nucleotide similarities with FASTA. Current protocols in bioinformatics, 2016. 53(1): p. 3.9. 1-3.9. 25. [DOI] [PMC free article] [PubMed]
- 7.Madden T, The BLAST sequence analysis tool, in The NCBI Handbook [Internet]. 2nd edition. 2013, National Center for Biotechnology Information (US).
- 8.Xu Baofang, Liu Dongyang, Wang Zerong, Tian Ruixia, Zuo Yongchun. Multi-substrate selectivity based on key loops and non-homologous domains: new insight into ALKBH family. Cell Mol Life Sci. 2021;78(1):129–141. doi: 10.1007/s00018-020-03594-9. [DOI] [PMC free article] [PubMed] [Google Scholar]
- 9.Liu Yu, Li Ao, Zhao Xing-Ming, Wang Minghui. DeepTL-Ubi: a novel deep transfer learning method for effectively predicting ubiquitination sites of multiple species. Methods. 2021;192:103–111. doi: 10.1016/j.ymeth.2020.08.003. [DOI] [PubMed] [Google Scholar]
- 10.Zhang Dan, Chen Hua-Dong, Zulfiqar Hasan, Yuan Shi-Shi, Huang Qin-Lai, Zhang Zhao-Yue. iBLP: An XGBoost-based predictor for identifying bioluminescent proteins. Comput Math Methods Med. 2021;2021:1–15. doi: 10.1155/2021/6664362. [DOI] [PMC free article] [PubMed] [Google Scholar]
- 11.Zulfiqar Hasan, Masoud Muhammad Shareef, Yang Hui, Han Shu-Guang, Wu Cheng-Yan, Lin Hao. Screening of Prospective Plant Compounds as H1R and CL1R inhibitors and its antiallergic efficacy through molecular docking approach. Comput Math Methods Med. 2021;2021:1–9. doi: 10.1155/2023/9832631. [DOI] [PMC free article] [PubMed] [Google Scholar]
- 12.Dao Fu-Ying, Lv Hao, Yang Yu-He, Zulfiqar Hasan, Gao Hui, Lin Hao. Computational identification of N6-methyladenosine sites in multiple tissues of mammals. Comput Struct Biotechnol J. 2020;18:1084–1091. doi: 10.1016/j.csbj.2020.04.015. [DOI] [PMC free article] [PubMed] [Google Scholar]
- 13.Yang Yu-He, Ma Chi, Wang Jia-Shu, Yang Hui, Ding Hui, Han Shu-Guang. Prediction of N7-methylguanosine sites in human RNA based on optimal sequence features. Genomics. 2020;112(6):4342–4347. doi: 10.1016/j.ygeno.2020.07.035. [DOI] [PubMed] [Google Scholar]
- 14.Mohabatkar H. Prediction of cyclin proteins using Chou's pseudo amino acid composition. Protein Pept Lett. 2010;17(10):1207–1214. doi: 10.2174/092986610792231564. [DOI] [PubMed] [Google Scholar]
- 15.Sun Jia-Nan, Yang Hua-Yi, Yao Jing, Ding Hui, Han Shu-Guang, Wu Cheng-Yan. Prediction of cyclin protein using two-step feature selection technique. IEEE Access. 2020;8:109535–109542. [Google Scholar]
- 16.Zuo Y et al., iDEF-PseRAAC: identifying the defensin peptide by using reduced amino acid composition descriptor. Evolutionary Bioinformatics, 2019. 15: p. 1176934319867088. [DOI] [PMC free article] [PubMed]
- 17.Wu Jianping, Aluko Rotimi E. Quantitative structure-activity relationship study of bitter di-and tri-peptides including relationship with angiotensin I-converting enzyme inhibitory activity. J Peptide Sci. 2007;13(1):63–69. doi: 10.1002/psc.800. [DOI] [PubMed] [Google Scholar]
- 18.Chen Zhen, Chen Yong-Zi, Wang Xiao-Feng, Wang Chuan, Yan Ren-Xiang, Zhang Ziding. Prediction of ubiquitination sites by using the composition of k-spaced amino acid pairs. PLoS ONE. 2011;6(7):e22930. doi: 10.1371/journal.pone.0022930. [DOI] [PMC free article] [PubMed] [Google Scholar]
- 19.Chen Wei, Feng Pengmian, Nie Fulei. iATP: A sequence based method for identifying anti-tubercular peptides. Med Chem. 2020;16(5):620–625. doi: 10.2174/1573406415666191002152441. [DOI] [PubMed] [Google Scholar]
- 20.Sokal R.R., Thomson B.A. Population structure inferred by local spatial autocorrelation: an example from an Amerindian tribal population. Am J Phys Anthropol. 2006;129(1):121–131. doi: 10.1002/ajpa.20250. [DOI] [PubMed] [Google Scholar]
- 21.Horne David S. Prediction of protein helix content from an autocorrelation analysis of sequence hydrophobicities. Biopolymers. 1988;27(3):451–477. doi: 10.1002/bip.360270308. [DOI] [PubMed] [Google Scholar]
- 22.Cai C.Z., Han L.Y., Ji Z.L., Chen Y.Z. Enzyme family classification by support vector machines. Proteins Struct Funct Bioinf. 2004;55(1):66–76. doi: 10.1002/prot.20045. [DOI] [PubMed] [Google Scholar]
- 23.Chou Kuo-Chen. Prediction of protein cellular attributes using pseudo-amino acid composition. Proteins Struct Funct Bioinf. 2001;43(3):246–255. doi: 10.1002/prot.1035. [DOI] [PubMed] [Google Scholar]
- 24.Zuo Yongchun, Li Yuan, Chen Yingli, Li Guangpeng, Yan Zhenhe, Yang Lei. PseKRAAC: a flexible web server for generating pseudo K-tuple reduced amino acids composition. Bioinformatics. 2017;33(1):122–124. doi: 10.1093/bioinformatics/btw564. [DOI] [PubMed] [Google Scholar]
- 25.Ke G. Lightgbm: a highly efficient gradient boosting decision tree. Adv Neural Inf Process Syst. 2017;30:3146–3154. [Google Scholar]
- 26.Tang Hua, Zhao Ya-Wei, Zou Ping, Zhang Chun-Mei, Chen Rong, Huang Po. HBPred: a tool to identify growth hormone-binding proteins. Int J Biol Sci. 2018;14(8):957–964. doi: 10.7150/ijbs.24174. [DOI] [PMC free article] [PubMed] [Google Scholar]
- 27.De Jay N et al., mRMRe: an R package for parallelized mRMR ensemble feature selection. Bioinformatics, 2013. 29(18): p. 2365-2368. [DOI] [PubMed]
- 28.Yang Wuritu, Zhu Xiao-Juan, Huang Jian, Ding Hui, Lin Hao. A Brief Survey of Machine Learning Methods in Protein Sub-Golgi Localization. Curr Bioinform. 2019;14(3):234–240. [Google Scholar]
- 29.Su Wei, Liu Meng-Lu, Yang Yu-He, Wang Jia-Shu, Li Shi-Hao, Lv Hao. PPD: a manually curated database for experimentally verified prokaryotic promoters. J Mol Biol. 2021;433(11):166860. doi: 10.1016/j.jmb.2021.166860. [DOI] [PubMed] [Google Scholar]
- 30.Ning L et al., MNDR v3.0: mammal ncRNA-disease repository with increased coverage and annotation. Nucleic Acids Res, 2021. 49(D1): p. D160-d164. [DOI] [PMC free article] [PubMed]
- 31.Liang Z.Y. Pro54DB: a database for experimentally verified sigma-54 promoters. Bioinformatics. 2017;33(3):467–469. doi: 10.1093/bioinformatics/btw630. [DOI] [PubMed] [Google Scholar]
- 32.Hong Z. Identifying enhancer–promoter interactions with neural network based on pre-trained DNA vectors and attention mechanism. Bioinformatics. 2020;36(4):1037–1043. doi: 10.1093/bioinformatics/btz694. [DOI] [PubMed] [Google Scholar]
- 33.Zeng X et al., deepDR: a network-based deep learning approach to in silico drug repositioning. Bioinformatics, 2019. 35(24): p. 5191-5198. [DOI] [PMC free article] [PubMed]
- 34.Yu Liang, Wang Meng, Yang Yang, Xu Fengdan, Zhang Xu, Xie Fei. Predicting therapeutic drugs for hepatocellular carcinoma based on tissue-specific pathways. PLoS Comput Biol. 2021;17(2):e1008696. doi: 10.1371/journal.pcbi.1008696. [DOI] [PMC free article] [PubMed] [Google Scholar]
- 35.Zhao Xudong, Jiao Qing, Li Hangyu, Wu Yiming, Wang Hanxu, Huang Shan. ECFS-DEA: an ensemble classifier-based feature selection for differential expression analysis on expression profiles. BMC Bioinf. 2020;21(1):43. doi: 10.1186/s12859-020-3388-y. [DOI] [PMC free article] [PubMed] [Google Scholar]
- 36.Fu L et al., CD-HIT: accelerated for clustering the next-generation sequencing data. Bioinformatics, 2012. 28(23): p. 3150-3152. [DOI] [PMC free article] [PubMed]
- 37.Zheng Nantao, Wang Kairou, Zhan Weihua, Deng Lei. Targeting virus-host protein interactions: Feature extraction and machine learning approaches. Curr Drug Metab. 2019;20(3):177–184. doi: 10.2174/1389200219666180829121038. [DOI] [PubMed] [Google Scholar]
- 38.Zeng X et al., Predicting disease-associated circular RNAs using deep forests combined with positive-unlabeled learning methods. Briefings in bioinformatics, 2020. 21(4): p. 1425-1436. [DOI] [PubMed]
- 39.Min X et al., Predicting enhancer-promoter interactions by deep learning and matching heuristic. Briefings in Bioinformatics, 2021. Doi: 10.1093/bib/bbaa254. [DOI] [PubMed]
- 40.Shang Yifan, Gao Lin, Zou Quan, Yu Liang. Prediction of drug-target interactions based on multi-layer network representation learning. Neurocomputing. 2021;434:80–89. [Google Scholar]
- 41.Liu Bingqiang, Han Ling, Liu Xiangrong, Wu Jichang, Ma Qin. Computational prediction of sigma-54 promoters in bacterial genomes by integrating motif finding and machine learning strategies. IEEE/ACM Trans Comput Biol Bioinf. 2019;16(4):1211–1218. doi: 10.1109/TCBB.2018.2816032. [DOI] [PubMed] [Google Scholar]
- 42.Zeng Xiangxiang, Zhu Siyi, Lu Weiqiang, Liu Zehui, Huang Jin, Zhou Yadi. Target identification among known drugs by deep learning from heterogeneous networks. Chem Sci. 2020;11(7):1775–1797. doi: 10.1039/c9sc04336e. [DOI] [PMC free article] [PubMed] [Google Scholar]
- 43.Lin X et al., A novel molecular representation with BiGRU neural networks for learning atom. Briefings in Bioinformatics, 2020. 21(6): p. 2099–2111. [DOI] [PubMed]
- 44.Yu Liang, Shi Yayong, Zou Quan, Wang Shuhang, Zheng Liping, Gao Lin. Exploring drug treatment patterns based on the action of drug and multilayer network model. Int J Mol Sci. 2020;21(14):5014. doi: 10.3390/ijms21145014. [DOI] [PMC free article] [PubMed] [Google Scholar]
- 45.Lv Zhibin, Jin Shunshan, Ding Hui, Zou Quan. A random forest sub-golgi protein classifier optimized via dipeptide and amino acid composition features. Front Bioeng Biotechnol. 2019;7 doi: 10.3389/fbioe.2019.00215. [DOI] [PMC free article] [PubMed] [Google Scholar]
- 46.Schaduangrat Nalini, Nantasenamat Chanin, Prachayasittikul Virapong, Shoombuatong Watshara. ACPred: a computational tool for the prediction and analysis of anticancer peptides. Molecules. 2019;24(10):1973. doi: 10.3390/molecules24101973. [DOI] [PMC free article] [PubMed] [Google Scholar]
- 47.Win Thet Su, Malik Aijaz Ahmad, Prachayasittikul Virapong, S Wikberg Jarl E, Nantasenamat Chanin, Shoombuatong Watshara. HemoPred: a web server for predicting the hemolytic activity of peptides. Future Med Chem. 2017;9(3):275–291. doi: 10.4155/fmc-2016-0188. [DOI] [PubMed] [Google Scholar]
- 48.Win Thet Su, Schaduangrat Nalini, Prachayasittikul Virapong, Nantasenamat Chanin, Shoombuatong Watshara. PAAP: A web server for predicting antihypertensive activity of peptides. Future Med Chem. 2018;10(15):1749–1767. doi: 10.4155/fmc-2017-0300. [DOI] [PubMed] [Google Scholar]
- 49.Shoombuatong W., Schaduangrat N., Nantasenamat C. Unraveling the bioactivity of anticancer peptides as deduced from machine learning. EXCLI J. 2018;17:734. doi: 10.17179/excli2018-1447. [DOI] [PMC free article] [PubMed] [Google Scholar]
- 50.Tao Z. A method for identifying vesicle transport proteins based on LibSVM and MRMD. Comput Math Methods Med. 2020;2020:8926750. doi: 10.1155/2020/8926750. [DOI] [PMC free article] [PubMed] [Google Scholar]
- 51.Fu X et al., StackCPPred: a stacking and pairwise energy content-based prediction of cell-penetrating peptides and their uptake efficiency. Bioinformatics, 2020. 36(10): p. 3028-3034. [DOI] [PubMed]
- 52.Dubchak I., Muchnik I., Holbrook S.R., Kim S.H. Prediction of protein folding class using global description of amino acid sequence. Proc Natl Acad Sci. 1995;92(19):8700–8704. doi: 10.1073/pnas.92.19.8700. [DOI] [PMC free article] [PubMed] [Google Scholar]
- 53.Zheng L et al., RaacLogo: a new sequence logo generator by using reduced amino acid clusters. Brief Bioinform, 2020. [DOI] [PubMed]
- 54.Zheng L et al., RAACBook: a web server of reduced amino acid alphabet for sequence-dependent inference by using Chou's five-step rule. Database (Oxford), 2019. 2019. [DOI] [PMC free article] [PubMed]
- 55.Kawashima S., Pokarowski P., Pokarowska M., Kolinski A., Katayama T., Kanehisa M. AAindex: amino acid index database, progress report 2008. Nucleic Acids Res. 2007;36(Database):D202–D205. doi: 10.1093/nar/gkm998. [DOI] [PMC free article] [PubMed] [Google Scholar]
- 56.Dao FY et al., Identify origin of replication in Saccharomyces cerevisiae using two-step feature selection technique. Bioinformatics, 2019. 35(12): p. 2075-2083. [DOI] [PubMed]
- 57.Feng CQ et al., iTerm-PseKNC: a sequence-based tool for predicting bacterial transcriptional terminators. Bioinformatics, 2019. 35(9): p. 1469-1477. [DOI] [PubMed]
- 58.Chen Wei, Feng Pengmian, Liu Tao, Jin Dianchuan. Recent advances in machine learning methods for predicting heat shock proteins. Curr Drug Metab. 2019;20(3):224–228. doi: 10.2174/1389200219666181031105916. [DOI] [PubMed] [Google Scholar]
- 59.Zeng Xiangxiang, Wang Wen, Chen Cong, Yen Gary G. A consensus community-based particle swarm optimization for dynamic community detection. IEEE Trans Cybern. 2020;50(6):2502–2513. doi: 10.1109/TCYB.2019.2938895. [DOI] [PubMed] [Google Scholar]
- 60.Wang Tian, Luo Hao, Zeng Xiangxiang, Yu Zhiyong, Liu Anfeng, Sangaiah Arun Kumar. Mobility based trust evaluation for heterogeneous electric vehicles network in smart cities. IEEE Trans Intell Transp Syst. 2021;22(3):1797–1806. [Google Scholar]
- 61.Cheng Liang, Zhao Hengqiang, Wang Pingping, Zhou Wenyang, Luo Meng, Li Tianxin. Computational Methods for Identifying Similar Diseases. Mol Ther. Nucleic acids. 2019;18:590–604. doi: 10.1016/j.omtn.2019.09.019. [DOI] [PMC free article] [PubMed] [Google Scholar]
- 62.Cheng L, Computational and Biological Methods for Gene Therapy. Current Gene Therapy, 2019. 19(4): p. 210-210. [DOI] [PubMed]
- 63.Zhai Y. Identifying antioxidant proteins by using amino acid composition and protein-protein interactions. Front Cell Dev Biol. 2020;8 doi: 10.3389/fcell.2020.591487. [DOI] [PMC free article] [PubMed] [Google Scholar]
- 64.Zou Quan, Wan Shixiang, Ju Ying, Tang Jijun, Zeng Xiangxiang. Pretata: predicting TATA binding proteins with novel features and dimensionality reduction strategy. BMC Syst Biol. 2016;10(S4) doi: 10.1186/s12918-016-0353-5. [DOI] [PMC free article] [PubMed] [Google Scholar]
- 65.Deng L., Li W., Zhang J. LDAH2V: exploring meta-paths across multiple networks for lncRNA-disease association prediction. IEEE/ACM Trans Comput Biol Bioinf. 2019 doi: 10.1109/TCBB.2019.2946257. [DOI] [PubMed] [Google Scholar]
- 66.Lv H et al., A sequence-based deep learning approach to predict CTCF-mediated chromatin loop. Briefings in bioinformatics, 2021. [DOI] [PubMed]
- 67.Wang H et al., eHSCPr discriminating the cell identity involved in endothelial to hematopoietic transition. Bioinformatics, 2021. [DOI] [PubMed]
- 68.Zhao T et al., DeepLGP: a novel deep learning method for prioritizing lncRNA target genes. Bioinformatics, 2020. [DOI] [PubMed]
- 69.Zhao X. Identifying plant pentatricopeptide repeat proteins using a variable selection method. Front Plant Sci. 2021;12 doi: 10.3389/fpls.2021.506681. [DOI] [PMC free article] [PubMed] [Google Scholar]
- 70.Song QingJun, Jiang HaiYan, Liu Jing. Feature selection based on FDA and F-score for multi-class classification. Expert Syst Appl. 2017;81:22–27. [Google Scholar]
- 71.Rachburee N., Punlumjeak W. 2015 7th International Conference on Information Technology and Electrical Engineering (ICITEE) IEEE; 2015. A comparison of feature selection approach between greedy, IG-ratio, Chi-square, and mRMR in educational mining. [Google Scholar]
- 72.Lv Zhibin, Wang Donghua, Ding Hui, Zhong Bineng, Xu Lei. Escherichia Coli DNA N-4-methycytosine site prediction accuracy improved by light gradient boosting machine feature selection technology. IEEE Access. 2020;8:14851–14859. [Google Scholar]
- 73.Lv Z. RF-PseU: A Random Forest Predictor for RNA Pseudouridine Sites. Frontiers In Bioengineering And Biotechnology. 2020;8:134. doi: 10.3389/fbioe.2020.00134. [DOI] [PMC free article] [PubMed] [Google Scholar]
- 74.Tabachnick B.G., Fidell L.S. Thomson/Brooks/Cole Belmont; CA: 2007. Experimental designs using ANOVA. [Google Scholar]
- 75.Peng H., Long F., Ding C. Feature selection based on mutual information criteria of max-dependency, max-relevance, and min-redundancy. IEEE Trans Pattern Anal Mach Intell. 2005;27(8):1226–1238. doi: 10.1109/TPAMI.2005.159. [DOI] [PubMed] [Google Scholar]
- 76.Tan J.-X. Identification of hormone binding proteins based on machine learning methods. Math. Biosci. Eng. 2019;16(4):2466–2480. doi: 10.3934/mbe.2019123. [DOI] [PubMed] [Google Scholar]
- 77.Yang Hui, Luo Yamei, Ren Xiaolei, Wu Ming, He Xiaolin, Peng Bowen. Risk Prediction of Diabetes: Big data mining with fusion of multifarious physical examination indicators. Information Fusion. 2021;75:140–149. [Google Scholar]
- 78.Charoenkwan P et al., BERT4Bitter: a bidirectional encoder representations from transformers (BERT)-based model for improving the prediction of bitter peptides. Bioinformatics, 2021. [DOI] [PubMed]
- 79.Wei L et al., Computational prediction and interpretation of cell-specific replication origin sites from multiple eukaryotes by exploiting stacking framework. Brief Bioinform, 2020. [DOI] [PubMed]
- 80.Hasan MM, et al., HLPpred-Fuse: improved and robust prediction of hemolytic peptide and its activity by fusing multiple feature representation. Bioinformatics, 2020. 36(11): p. 3350-3356. [DOI] [PubMed]
- 81.Cheng L, et al., MetSigDis: a manually curated resource for the metabolic signatures of diseases. Brief Bioinform, 2019. 20(1): p. 203-209. [DOI] [PubMed]
- 82.Cheng L, et al., DincRNA: a comprehensive web-based bioinformatics toolkit for exploring disease associations and ncRNA function. Bioinformatics, 2018. 34(11): p. 1953-1956. [DOI] [PubMed]
- 83.Wang X, et al., The stacking strategy-based hybrid framework for identifying non-coding RNAs. Brief Bioinform, 2021. [DOI] [PubMed]
- 84.Zulfiqar H. Computational identification of N4-methylcytosine sites in the mouse genome with machine-learning method. Mathematical Biosci Eng. 2021;18(4):3348–3363. doi: 10.3934/mbe.2021167. [DOI] [PubMed] [Google Scholar]
- 85.Dao FY, et al., A computational platform to identify origins of replication sites in eukaryotes. Briefings in bioinformatics, 2021. 22(2): p. 1940-1950. [DOI] [PubMed]
- 86.Feng P.M. Naive Bayes classifier with feature selection to identify phage virion proteins. Comput Math Methods Med. 2013;2013 doi: 10.1155/2013/530696. [DOI] [PMC free article] [PubMed] [Google Scholar]
- 87.Zhang Zi-Mei, Wang Jia-Shu, Zulfiqar Hasan, Lv Hao, Dao Fu-Ying, Lin Hao. Early diagnosis of pancreatic ductal adenocarcinoma by combining relative expression orderings with machine-learning method. Front Cell Dev Biol. 2020;8 doi: 10.3389/fcell.2020.582864. [DOI] [PMC free article] [PubMed] [Google Scholar]
- 88.Schapire, R.E., Explaining adaboost, in Empirical inference. 2013, Springer. p. 37-52.
- 89.Sun R. A gradient boosting decision tree based GPS signal reception classification algorithm. Appl Soft Comput. 2020;86 [Google Scholar]
- 90.Liu Kewei, Chen Wei, Lin Hao. XG-PseU: an eXtreme Gradient Boosting based method for identifying pseudouridine sites. Mol Genet Genomics. 2020;295(1):13–21. doi: 10.1007/s00438-019-01600-9. [DOI] [PubMed] [Google Scholar]
- 91.Abraham A. Machine learning for neuroimaging with scikit-learn. Front Neuroinf. 2014;8:14. doi: 10.3389/fninf.2014.00014. [DOI] [PMC free article] [PubMed] [Google Scholar]
- 92.Lv Z, et al., Identification of Sub-Golgi protein localization by use of deep representation learning features. Bioinformatics (Oxford, England), 2020. [DOI] [PMC free article] [PubMed]
- 93.Panja Anindya Sundar, Nag Akash, Bandopadhyay Bidyut, Maiti Smarajit. Protein Stability Determination (PSD): A tool for proteomics analysis. Curr Bioinform. 2018;14(1):70–77. [Google Scholar]
- 94.Khan Yaser Daanial, Alzahrani Ebraheem, Alghamdi Wajdi, Ullah Malik Zaka. Sequence-based Identification of Allergen Proteins Developed by Integration of PseAAC and Statistical Moments via 5-Step Rule. Curr Bioinform. 2021;15(9):1046–1055. [Google Scholar]
- 95.Tahir Muhammad, Idris Adnan. MD-LBP: an efficient computational model for protein subcellular localization from HeLa Cell Lines Using SVM. Curr Bioinform. 2020;15(3):204–211. [Google Scholar]
- 96.Wang Xian-Fang, Gao Peng, Liu Yi-Feng, Li Hong-Fei, Lu Fan. Predicting thermophilic proteins by machine learning. Curr Bioinform. 2020;15(5):493–502. [Google Scholar]
- 97.Yang Yingjuan, Fan Chunlong, Zhao Qi. Recent advances on the machine learning methods in identifying phage virion proteins. Curr Bioinform. 2020;15(7):657–661. [Google Scholar]
- 98.Liu K, Chen W, iMRM:a platform for simultaneously identifying multiple kinds of RNA modifications. Bioinformatics, 2020. 36(11): p. 3336-3342. [DOI] [PubMed]
- 99.Basith Shaherin, Manavalan Balachandran, Hwan Shin Tae, Lee Gwang. Machine intelligence in peptide therapeutics: a next-generation tool for rapid disease screening. Med Res Rev. 2020;40(4):1276–1314. doi: 10.1002/med.21658. [DOI] [PubMed] [Google Scholar]
- 100.Manavalan Balachandran, Basith Shaherin, Shin Tae Hwan, Wei Leyi, Lee Gwang. Meta-4mCpred: A Sequence-Based Meta-Predictor for Accurate DNA 4mC site prediction using effective feature representation. Mol Ther Nucleic Acids. 2019;16:733–744. doi: 10.1016/j.omtn.2019.04.019. [DOI] [PMC free article] [PubMed] [Google Scholar]
- 101.Yu Liang, Zhou Dandan, Gao Lin, Zha Yunhong. Prediction of drug response in multilayer networks based on fusion of multiomics data. Methods (San Diego, Calif.) 2021;192:85–92. doi: 10.1016/j.ymeth.2020.08.006. [DOI] [PubMed] [Google Scholar]
- 102.Charoenkwan Phasit, Kanthawong Sakawrat, Nantasenamat Chanin, Hasan Md. Mehedi, Shoombuatong Watshara. iDPPIV-SCM: a sequence-based predictor for identifying and analyzing dipeptidyl peptidase IV (DPP-IV) inhibitory peptides using a scoring card method. J Proteome Res. 2020;19(10):4125–4136. doi: 10.1021/acs.jproteome.0c00590. [DOI] [PubMed] [Google Scholar]
- 103.Charoenkwan Phasit, Yana Janchai, Nantasenamat Chanin, Hasan Md. Mehedi, Shoombuatong Watshara. iUmami-SCM: a novel sequence-based predictor for prediction and analysis of umami peptides using a scoring card method with propensity scores of dipeptides. J Chem Inf Model. 2020;60(12):6666–6678. doi: 10.1021/acs.jcim.0c00707. [DOI] [PubMed] [Google Scholar]
- 104.Wang G, et al., MeDReaders: a database for transcription factors that bind to methylated DNA. Nucleic Acids Res, 2018. 46(D1): p. D146-D151. [DOI] [PMC free article] [PubMed]
- 105.Stephenson Natalie, Shane Emily, Chase Jessica, Rowland Jason, Ries David, Justice Nicola. Survey of machine learning techniques in drug discovery. Curr Drug Metab. 2019;20(3):185–193. doi: 10.2174/1389200219666180820112457. [DOI] [PubMed] [Google Scholar]
- 106.Cao Renzhi, Freitas Colton, Chan Leong, Sun Miao, Jiang Haiqing, Chen Zhangxin. Protein function prediction using neural machine translation based on a recurrent neural network. Molecules. 2017;22(10) doi: 10.3390/molecules22101732. [DOI] [PMC free article] [PubMed] [Google Scholar]
- 107.Kalita Mridul K., Nandal Umesh K., Pattnaik Ansuman, Sivalingam Anandhan, Ramasamy Gowthaman, Kumar Manish. CyclinPred: a SVM-based method for predicting cyclin protein sequences. PLoS ONE. 2008;3(7):e2605. doi: 10.1371/journal.pone.0002605. [DOI] [PMC free article] [PubMed] [Google Scholar]
- 108.Lv Z, et al., Anticancer peptides prediction with deep representation learning features. Briefings in bioinformatics, 2021. [DOI] [PubMed]
- 109.Ahmad Fareed, Farooq Amjad, Ghani Khan Muhammad Usman, Shabbir Muhammad Zubair, Rabbani Masood, Hussain Irshad. Identification of most relevant features for classification of francisella tularensis using machine learning. Curr Bioinform. 2021;15(10):1197–1212. [Google Scholar]
- 110.Amanat Saba, Ashraf Adeel, Hussain Waqar, Rasool Nouman, Khan Yaser D. Identification of lysine carboxylation sites in proteins by integrating statistical moments and position relative features via general PseAAC. Curr Bioinform. 2020;15(5):396–407. [Google Scholar]
- 111.Ayachit Garima, Shaikh Inayatullah, Pandya Himanshu, Das Jayashankar. Salient Features, Data and Algorithms for MicroRNA Screening from Plants: A Review on the Gains and Pitfalls of Machine Learning Techniques. Curr Bioinform. 2021;15(10):1091–1103. [Google Scholar]
- 112.Kong Liang, Zhang Lichao, He Shiqian. Improving multi-type gram-negative bacterial secreted protein prediction via protein evolutionary information and feature ranking. Curr Bioinform. 2020;15(6):538–546. [Google Scholar]
- 113.Li Hong-Dong, Zhang Wenjing, Luo Yuwen, Wang Jianxin. IsoDetect: detection of splice isoforms from third generation long reads based on short feature sequences. Curr Bioinform. 2021;15(10):1168–1177. [Google Scholar]
- 114.Zhang Ge, Yu Pan, Wang Jianlin, Yan Chaokun. Feature selection algorithm for high-dimensional biomedical data using information gain and improved chemical reaction optimization. Curr Bioinform. 2021;15(8):912–926. [Google Scholar]
- 115.Zhang Tianjiao, Wang Rongjie, Jiang Qinghua, Wang Yadong. An information gain-based method for evaluating the classification power of features towards identifying enhancers. Curr Bioinform. 2020;15(6):574–580. [Google Scholar]
- 116.Hasan Md. Mehedi, Manavalan Balachandran, Khatun Mst. Shamima, Kurata Hiroyuki. i4mC-ROSE, a bioinformatics tool for the identification of DNA N4-methylcytosine sites in the Rosaceae genome. Int J Biol Macromol. 2020;157:752–758. doi: 10.1016/j.ijbiomac.2019.12.009. [DOI] [PubMed] [Google Scholar]
- 117.Hasan MM, et al., Meta-i6mA: an interspecies predictor for identifying DNA N6-methyladenine sites of plant genomes by exploiting informative features in an integrative machine-learning framework. Brief Bioinform, 2020. [DOI] [PubMed]
Associated Data
This section collects any data citations, data availability statements, or supplementary materials included in this article.