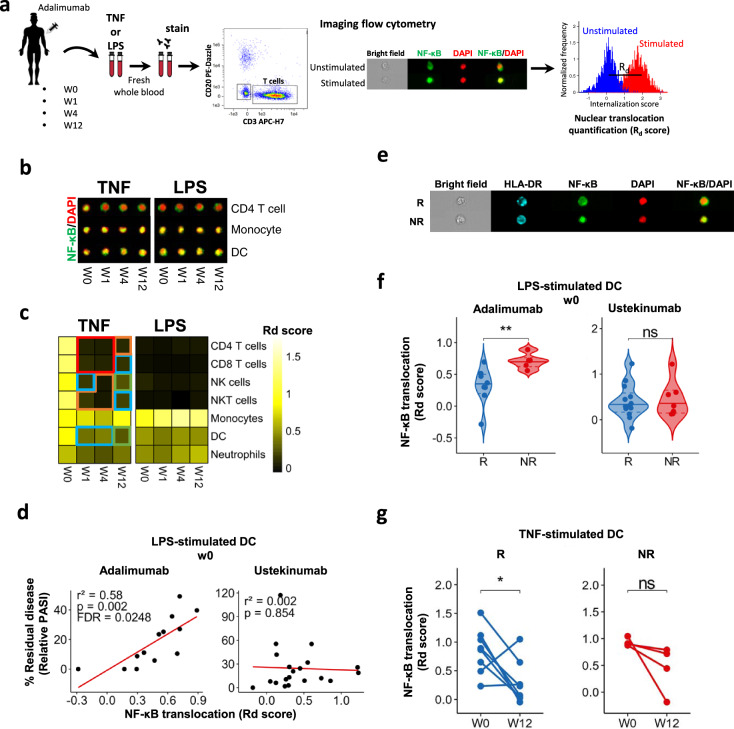
Fig. 1. LPS-induced NF-κB translocation in DCs at baseline correlates with response to adalimumab.
a Cartoon depicting the experimental workflow. Whole blood from psoriasis patients collected at baseline (week0, w0) and at w1, w4 and w12 after initiation of adalimumab therapy was stimulated with TNF, LPS or left unstimulated, stained with fluorescent antibodies and NF-κB nuclear translocation was measured in distinct cell populations identified by imaging flow cytometry, as shown in the representative images included in the cartoon. b Representative fluorescent images of selected cell populations stained for NF-κB (green) and nucleus (DAPI, red); their colocalization is shown in yellow. c Heatmap showing NF-κB nuclear translocation measured as Rd score in immune cell populations (n = 13–16). d Correlation analysis between NF-κB translocation (measured as Rd score) at w0 and clinical response expressed as percentage of residual disease at w12 (measured as relative PASI, i.e. PASI at w12/PASI at w0 X 100) in LPS-stimulated dendritic cells (DCs) in PSORT adalimumab (n = 13) and ustekinumab cohort (n = 24). Each dot represents one patient. e Representative fluorescent image of LPS-stimulated DCs at w0 from PASI75 adalimumab responder (R) and non-responder (NR). f Violin plot graphs of NF-κB translocation in LPS-stimulated DCs at w0 for PASI75 adalimumab and ustekinumab responders (blue, adalimumab = 8; ustekinumab = 13) and non-responders (red, adalimumab = 5; ustekinumab = 7) **p = 0.0062. g NF-κB translocation in TNF-stimulated DCs at w0 and w12 in adalimumab PASI75 responders (n = 8) and non-responders (n = 4). Red frame: FDR < 0.0001, orange frame: FDR < 0.001, blue frame: FDR < 0.01, green frame: FDR < 0.05 compared to week (w) 0, test. *p = 0.039, Wilcoxon test followed by FDR (c), Wilcoxon (g) or Mann–Whitney U test (f). All tests are two-sided. Source data are provided as a Source Data file.

