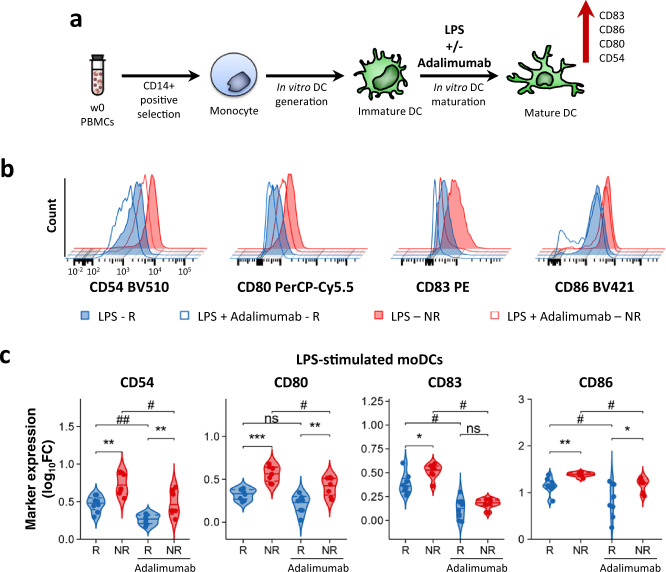
Fig. 3. LPS induces increased moDC maturation in adalimumab non-responders.
a moDCs were generated in vitro from monocytes obtained from w0 PBMCs. Maturation was induced by adding LPS in the presence or absence of adalimumab. b Representative flow overlay histograms of maturation markers expression in LPS-matured (filled) and LPS + adalimumab (empty) moDCs generated in PASI75 adalimumab responders (R, blue) and non-responders (NR, red). c Violin plot graphs of maturation markers expression (measured as log10FC MFI vs Immature DCs) in PASI-75 adalimumab responders (blue, n = 8) and non-responders (red, n = 7). (p CD54 RvsNR = 0.0012, RvsNR A = 0.0037; # CD54 = 0.0156, ## CD54 = 0.0078; p CD80 RvsNR = 0.0003, RvsNR A = 0.0037; # CD80 = 0.0156; p CD83 RvsNR = 0.04; # CD83 RvsR-A = 0.0156, NRvsNR-A = 0.0156; p CD86 RvsNR = 0.0022, RvsNR A = 0.02; # CD86 RvsR-A = 0.0391, NRvsNR-A = 0.0156), Mann–Whitney U test (c) between R and NR. ## p < 0.01, # p < 0.05, Two-sided Wilcoxon matched-pair rank test for adalimumab effect. Source data are provided as a Source Data file.

