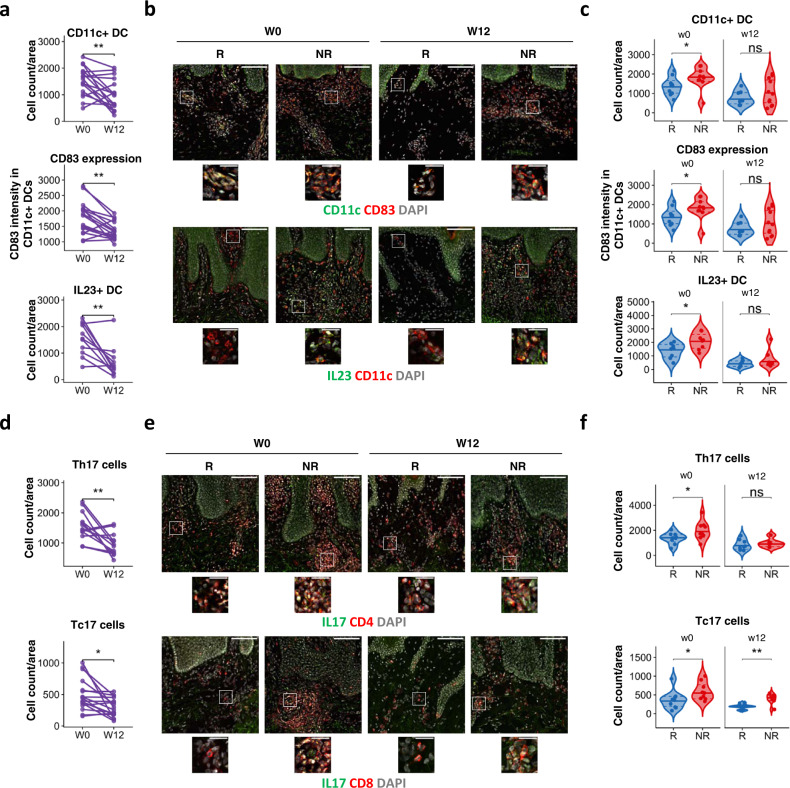
Fig. 5. Response to adalimumab is associated with DC and IL-17+ T cell activation.
Analysis of psoriasis lesional skin of patients at baseline (w0) and after 12 weeks (w12) of adalimumab treatment a Number of CD11c+ DCs, expression of CD83 in CD11c+ dermal dendritic cells (DC) and number of IL-23+ CD11c+ DC per area of analysis (750 × 750 μm) at different time points. Each line represents one patient (n CD11c and CD83 = 17, n IL23 = 11) (p CD11c = 0.0093, CD83 = 0.0012, IL23 = 0.0049). b Representative immunofluorescence images of psoriasis skin showing total number of CD11c+ DCs (top), CD83 expression in CD11c+ DC (middle) and IL23+ CD11c+ DC (bottom) in PASI75 adalimumab responders (R, n = 8–10) and non-responders (NR, n = 6–10). c Violin plot graphs of CD11c+ DC counts (top), CD83 expression in dermal DC (middle) and number of IL23 + DC in adalimumab responders (blue, n = 8–10) and non-responders (red, n = 6–10) at w0 and w12) (p CD11c = 0.043, CD83 = 0.035, IL23 = 0.039). d Number of IL-17A+CD4+ Th17 and IL-17A+CD8+ Tc17 cells per area of analysis at different time points. Each line represents one patient (n Th17 = 13, n Tc17 = 17) (p Th17 = 0.0013, Tc17 = 0.011). e Representative immunofluorescence images of psoriasis skin showing Th17 (top) and Tc17 (bottom) in adalimumab responders (n = 8–10) and NR (n = 6–9). f Violin plot graphs of the number of Th17 and Tc17 cells in lesional skin sections of in adalimumab responders (blue, n Th17 week 0 = 9, n Th17 week 12 = 8, n Tc17 week 0 = 10, n Tc17 week 12 = 9) and non-responders (red, n Th17 week 0 = 9, n Th17 week 12 = 6, n Tc17 week 0 = 9, n Tc17 week 12 = 8) at w0 and w12 (p Th17 = 0.04, Tc17 w0 = 0.028, Tc17 w12 = 0.0037). Wilcoxon test (a bottom panel), or paired t test (a except bottom panel, d), Mann–Whitney U test (c top panel, f) or unpaired t test (c except top panel). All tests are two-sided. Scale bars in (b, e): 100 µm (overview) and 25 µm (insets). Source data are provided as a Source Data file.

