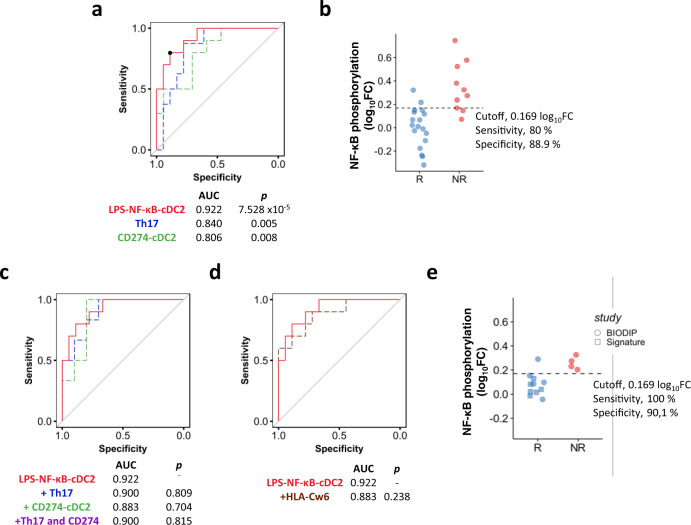
Fig. 6. NF-κB phosphorylation in cDC2 at baseline as biomarker of response to adalimumab.
a Receiver operator characteristic (ROC) of linear models for LPS-induced NF-κB phosphorylation in cDC2 at baseline (w0, red line), frequency of blood Th17 cells at baseline (w0, blue line) and PDL1 expression in cDC2 at w1 (green line) predicting PASI75 outcome in adalimumab patients at week 12 (combined cohort, n = 26–28). Black dot shows the cut-off for maximal accuracy for the best ROC curve. p values vs an AUC of 0.5 are shown on the graph. b Dot plot graph of the PSORT adalimumab combined cohort (n = 28) classified in PASI75 responder (R, blue, n = 18) and non-responders (NR, red, n = 10) according to the cut-off for LPS-induced NF-κB phosphorylation in cDC2 at w0. c ROC of LPS-induced NF-κB phosphorylation in cDC2 at w0 (solid red line) and combination biomarkers (LPS-NF-kB-cDC2 + Th17, dotted blue line; LPS-NF-kB-cDC2 + CD274-cDC2 dotted green line, and LPS-NF-kB-cDC2 + Th17 + CD274-DC2, dotted purple line). The purple line partially overlaps with the blue line. p values vs AUC of LPS-NF-kB-cDC2 are shown. d ROC analysis for LPS-NF-kB-cDC2 predicting PASI75 outcome in adalimumab patients (solid red line) and when combined with HLA-C*06:02 genotype (dotted brown). p value vs AUC of LPS-NF-kB-cDC2 is shown. e ROC clinical validation using optimal cut-off for LPS-induced NF-κB phosphorylation in cDC2 at w0 identified in the PSORT combined cohort to classify an independent cohort of adalimumab patients in PASI75 responders (blue, n = 11) and non-responders (red, n = 4) (clinical validation cohort). Two-tailed Mann–Whitney U test, (a, c, d). Source data are provided as a Source Data file.

