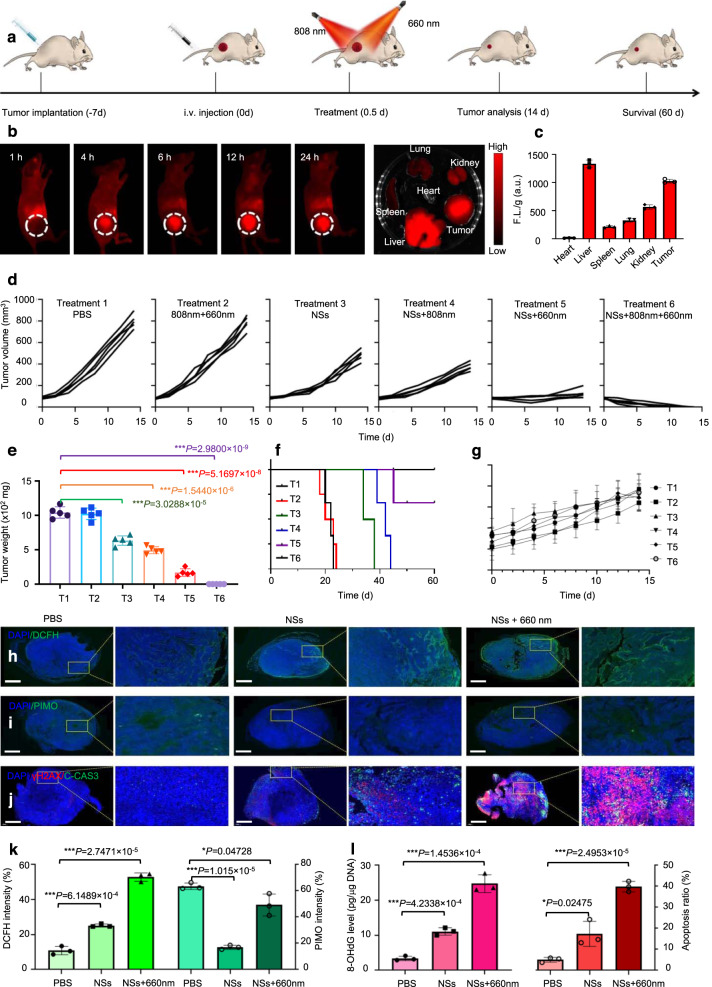
Fig. 9. In vivo imaging and anti-tumor performance of As/AsxOy@PDA@M NSs.
a Treatment schedule. b In vivo fluorescence images of nude mice after i.v. administration of NSs, and the ex vivo fluorescence images of the tumor and major organs at 24 h post-injection of As/AsxOy@PDA@M NSs with the excitation wavelength at 500 nm and emission wavelength at 795 nm. c Semiquantitative biodistribution of As/AsxOy@PDA@M NSs in tumor and major organs 24 h post-injection. Error bars = standard deviation (n = 3), n = 3 biologically independent samples. d Tumor growth curves of MCF-7 tumor-bearing nude mice. e Tumor weight in different groups after 14 days of treatment. Error bars = standard deviation (n = 5), n = 5 biologically independent mice. f Survival rate of mice undergoing different treatments. g Body weight of mice during treatment. Error bars = standard deviation (n = 5), n = 5 biologically independent mice. h In vivo ROS detection in the sections from tumors by dichlorodihydrofluorescein (DCFH) via fluorescence microscopy, scale bars = 1000 μm. i In vivo O2 generation in sections from tumors by pimonidazole (PIMO) via fluorescence microscopy, scale bars = 1000 μm. j Immunofluorescence (IF) staining in tumor sections after treatment with PBS, NSs, or NSs + 660 nm laser irradiation, scale bars = 1000 μm. The nucleus is stained by DAPI (blue), damaged DNA by γH2AX foci (red), and apoptotic cells by apoptosis marker C-CAS3 (green). k Quantification of the in vivo ROS and O2 signals from the tumors calculated from the section studies in h and i. l In vivo DNA damage of tumors measured by 8-OHdG assay and apoptosis ratio after different treatments. Error bars = standard deviation (n = 3), n = 3 biologically independent samples. For all statistical analysis, data are presented as mean values ± SEM. Two-sided ANOVAs were performed for all other comparisons. No adjustments were made for multiple comparisons. For the in vivo fluorescence images and tumor IF staining, three times each experiment was repeated independently with similar results.

