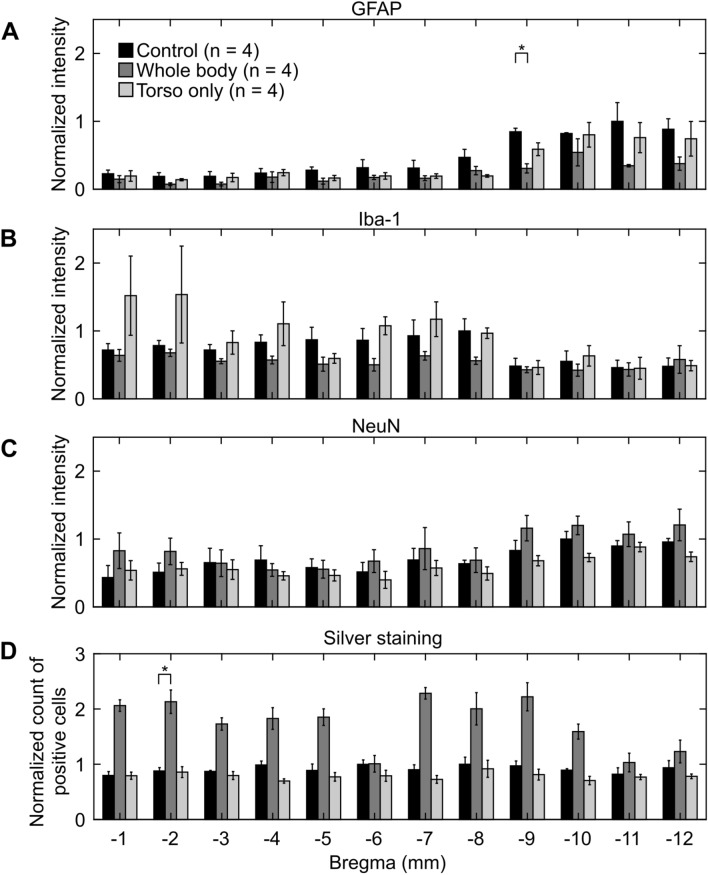
Figure 7.
Changes in coronal brain slices due to whole-body or torso-only blast exposure in the indirect-mechanism study, as indicated by (A) GFAP-positive, (B) Iba-1-positive, (C) NeuN-positive, and (D) silver staining. Asterisks denote statistically significant differences (p < 0.05) between blast-exposed (n = 4) and control (n = 4) groups. The bar heights and vertical line lengths represent the mean and one standard error of the mean (SEM), respectively. At each brain-slice region for each group, we determined the mean and SEM using the corresponding brain-slice data. For each staining assessment, we then normalized the data for controls by the highest control value. Lastly, we normalized the data from blast-exposed groups (i.e., whole-body and torso-only) by the data from their respective controls at each region. We normalized the data for presentation purposes only. We conducted all statistical analyses using the raw data with their respective values.

