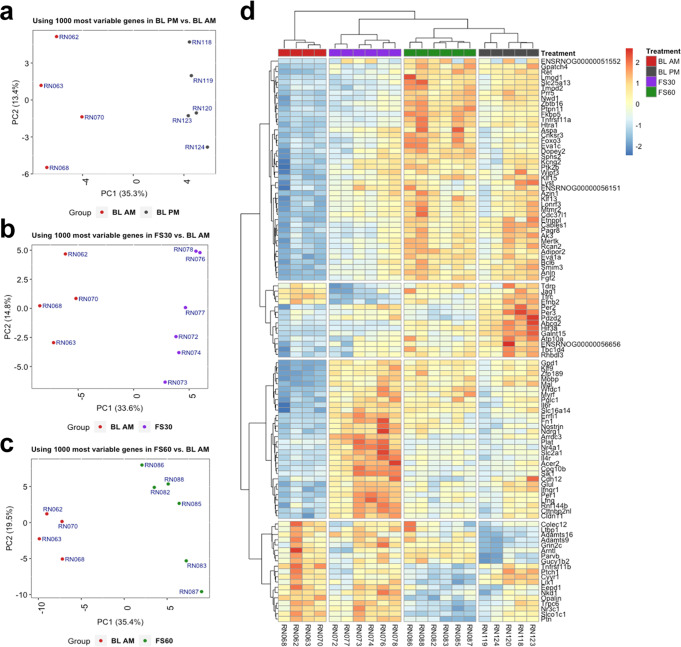
Fig. 3. RNA-Seq data analysis of rat hippocampal samples.
Samples were collected under BLAM, 30 or 60 min following forced swimming (FS30 or FS60, respectively), or under BLPM conditions. a-c Principal component analysis (PCA) of the top 1000 most variable genes based on intronic read counts revealed clear separation of experimental groups along the PC1 axis indicating much of the variance (~35%) associated with this eigenvector can be attributed to group for BLPM vs BLAM (a), FS30 vs BLAM (b) and FS60 vs BLAM (c) comparisons. d Heatmap showing centered log-scaled expression values in each sample for the top 104 differentially expressed genes (FDR < 0.05). Top 50 differentially expressed genes were identified, using intronic count data, in each comparison (FS30, FS60, and BLPM vs. BLAM conditions) and collated to a single list of 104 genes.

