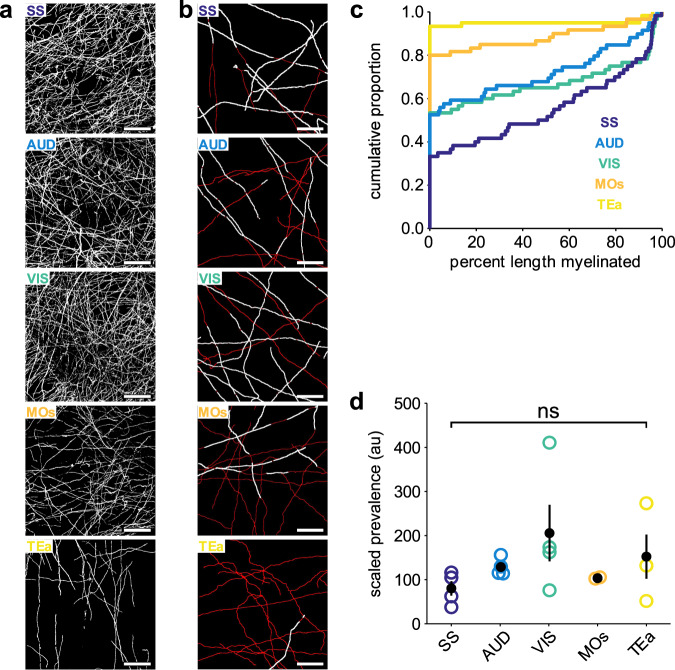
Fig. 3. PV axon myelination patterns are consistent across cortical regions.
a Representative binarized images of MBP immunostaining from all cortical regions analyzed (SS somatosensory, AUD auditory, VIS visual, MOs secondary motor, TEa temporal association area). Scale bars, 50 μm. b Example axon and myelin traces from each cortical region analyzed from a single PV-Cre; Ai9 flatmount. Red, axons; white, myelin. Scale bars, 50 μm. c Cumulative distribution plot of PLM from all axons traced in each region in a (SS, n = 60 axons from 4 mice; VIS, n = 60 axons from 4 mice; AUD, n = 59 axons from 4 mice; MOs, N = 30 axons from 2 mice; TEa, N = 37 axons from 3 mice). See Table 3 for PLM distribution statistics. d Scaled prevalence (MBP intensity/proportion of axons myelinated) of PV axon myelination across all regions analyzed (same Ns as in c) (ns not significant, p = 0.24, Kruskal–Wallis ANOVA). Error bars represent the standard error of the mean. Source data and statistical tests are provided as a Source Data file.

