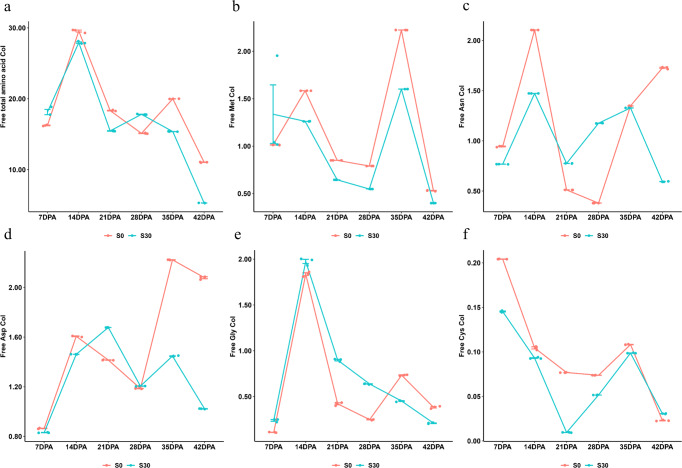
Fig. 5. Comparison of six free amino acid dynamics between different sulfur treatments across six grain-filling stages in 2015 glasshouse experiment.
Detailed information is shown in the Supplementary Note 1. For all panels, the S0 (red) and S30 (green) mean 0 and 30 kg ha−1 sulfur treatments, respectively; DPA days post-anthesis, CoI content index (free amino acid% × 104). The developing grain samples of three replicate pots from the same grain developing stage and sulfur treatment were pooled together, making it 12 pooled developing grain samples with three technical repeats each; line graph shows the means ± 3 technical repeats with a mix of three biologically independent replicates (or three pots); the dots with red and green show the data distribution of Spitfire under S0 and S30, respectively. a The comparison of the dynamics of free total amino acid CoI between S0 and S30 treatments during grain-filling. b The comparison of the dynamics of free methionine (Met) CoI between S0 and S30 treatments during grain-filling. c The comparison of the dynamics of free asparagine (Asn) CoI between S0 and S30 treatments during grain-filling. d The comparison of the dynamics of free aspartic acid (Asp) CoI between S0 and S30 treatments during grain-filling. e The comparison of the dynamics of free glycine (Gly) CoI between S0 and S30 treatments during grain-filling. f The comparison of the dynamics of free cysteine (Cys) CoI between S0 and S30 treatments during grain-filling.

