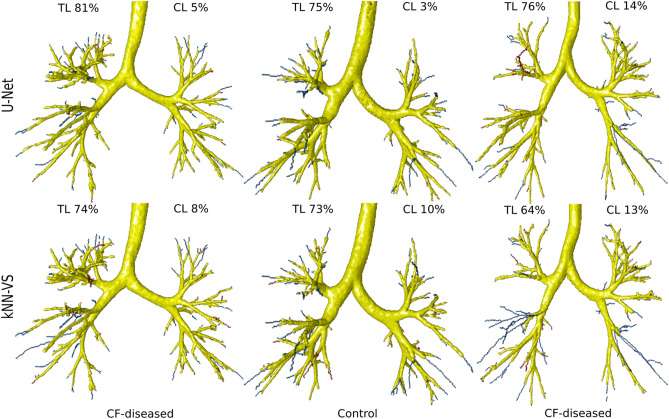
Figure 3.
Visualization of predicted airways trees on the CF-CT data, obtained by our U-Net-based method and the kNN-VS method43. True positives are displayed in yellow, centerline false negatives in blue and centerline false positives in red. These false negatives and positives are the errors counted in the tree length detected and centerline leakage measures reported in Fig. 2, respectively. The cases displayed correspond to, from left to right, the two U-Net results with Dice score closest to the median of the test Dice measures, and the U-Net result with the lowest Dice score.

