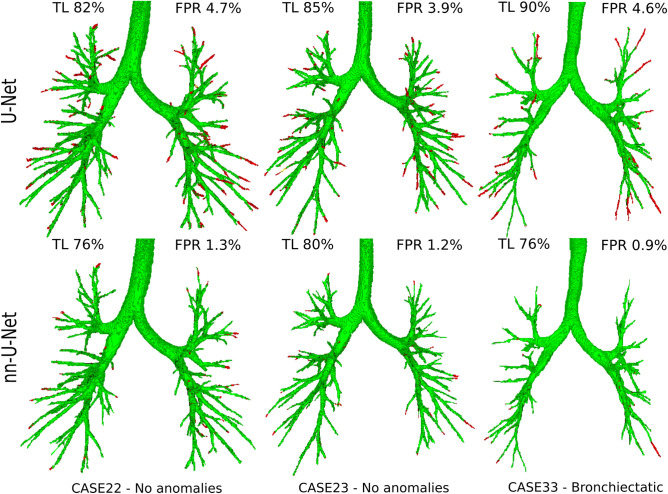
Figure 8.
Visualization of predicted airway trees on the EXACT’09 data obtained by our U-Net-based method and the nnU-Net method46. True positives are displayed in green and false positives in red, indicated according to the EXACT’09 evaluation. The cases displayed correspond to 3 out of the 5 U-Net results with the highest false positive rate reported in the EXACT’09 evaluation, where we found through visual inspection that many of the reported false positives are real airways on the CT scan, which were presumably missing in the EXACT’09 reference.

