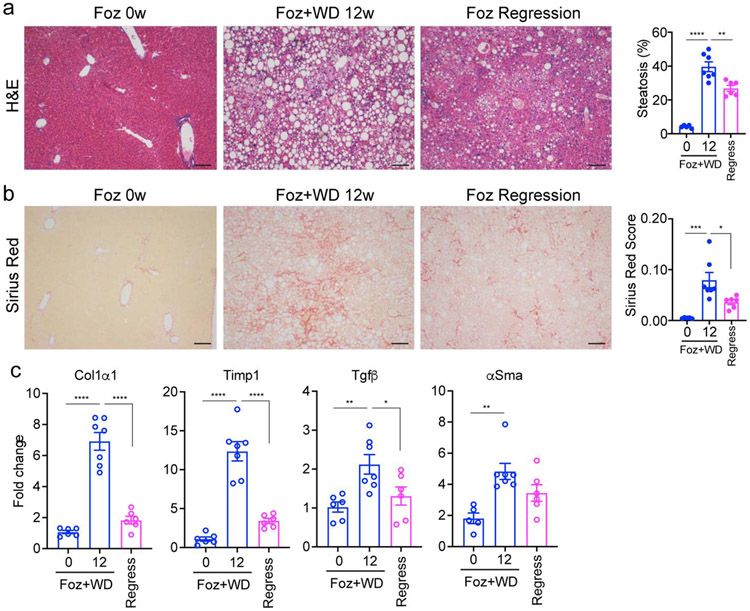
Figure 1. Progression and regression of fibrosis in foz/foz mice.
Six weeks old foz/foz mice were fed either standard chow (0w) or WD for 12 weeks (12w) or subjected to regression by switching 12w WD fed mice to standard chow for 8 additional weeks. Representative images of liver histology depicting steatosis (a; hematoxylin-eosin (H&E) staining) and fibrosis (b; sirius red staining; quantified as sirius red positive area normalized to non-steatotic area); Scale bar: 100 μm. (c) Total RNA was extracted from the liver lysates and expression of indicated fibrogenic markers were analyzed by qPCR. The data is represented as fold induction versus foz/foz mice on standard chow (0w WD group). All bar graphs represent mean ± SEM, *p <0.05, **p <0.01, ***p <0.001, ****p <0.0001 by ANOVA.

